The development in Lithuania is dependent and explained by its level of Human Development Index (HDI).
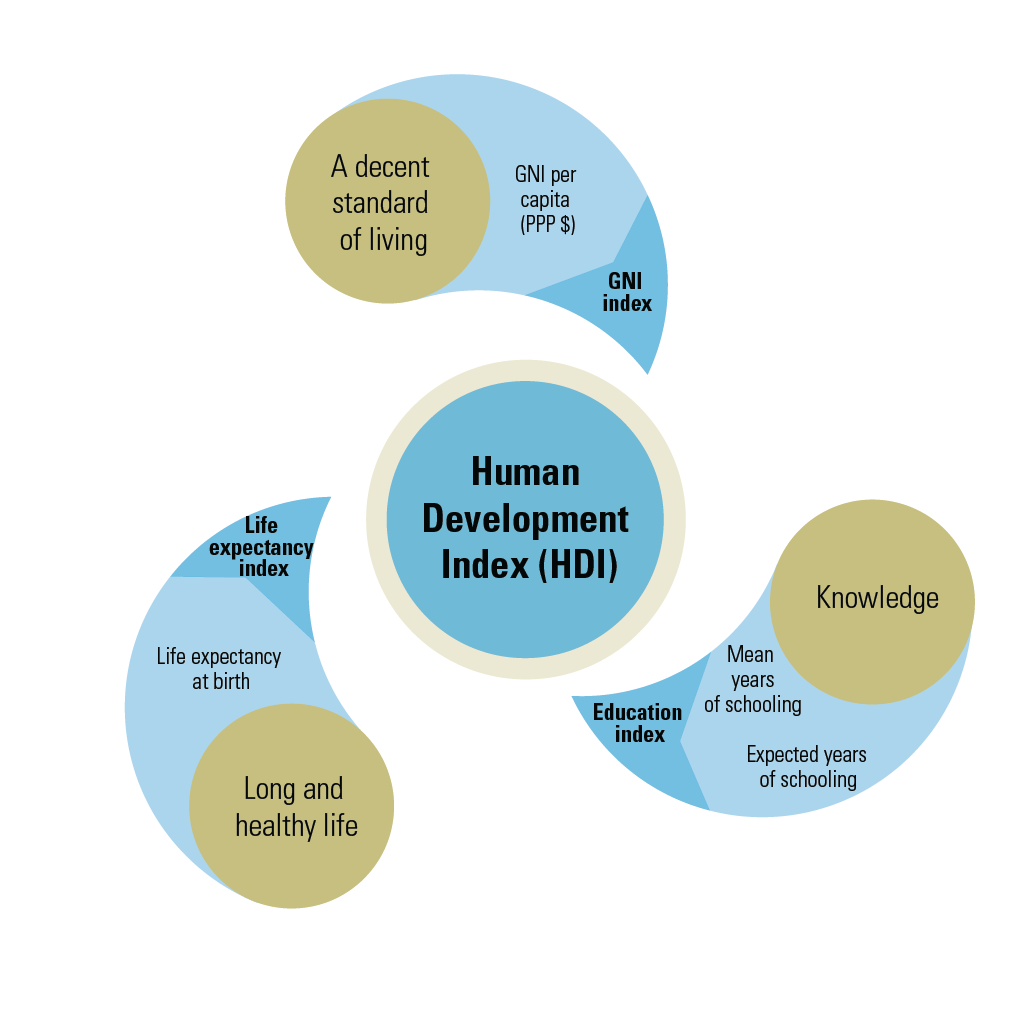
The level of development is often mistakenly measured by pure income attribute, such as GDP or GDP per capita (PPP). The United Nations Human Development Index is more applicable measure to human development as it incorporates not only the level GDP, but also other metrics, such as the level of education achieved and human life expectency. The Human Developments Index (HDI) reflects the overall development level of the society as a whole, rather than its pure income.
In this analysis, the United Nations Human Development Index (HDI) is chosen as a key indicator of the development of the Republic of Lithuania.
Since 2012, the United Nations also compile the official World Happiness Report. This report reveals the level of happiness achieved by any country in the world. The level of hapiness is based on based on respondent ratings of their own lives (i.e. by a survey), which the report also correlates with various quality of life factors.

Looking at the top10 of the happiest countries in the world in 2020, the gut feeling kicks in that the richest countries tend to be also the happiest countries. However, is it always the case if we go deep down?

If we take OECD country ranking of their happiness levels in 2019, one can spot that Lithuania ranks higher than Estonia, South Korea or even Japan, which are locally perceived as "the richer countries". Thus, guessing by the gut feeling, one may state that the level of happiness does not necessarily correspond to how rich or developed the country is.
This analysis looks into whether the path of the country's development corresponds to its level of happiness. As a focus of this analysis, we specifically look into the case of the Republic of Lithuania.
In this research, I extracted datasets from Kaggle. For both World Health Report and Human Development Index, I will extract data from MySQL databases, which concern the years from 2015 to 2019. This decision is limited by the fact that no earlier data for World Health Report could be recorded earlier than 2015 and no later data could be recorded for Human Development Index later than 2019. Each dataset has up to 200 rows, which correspondes to the number of countries in any particular year.
import pandas as pd
pip install mysql-connector-python
Requirement already satisfied: mysql-connector-python in ./opt/anaconda3/lib/python3.9/site-packages (8.0.27)
Requirement already satisfied: protobuf>=3.0.0 in ./opt/anaconda3/lib/python3.9/site-packages (from mysql-connector-python) (3.19.1)
Note: you may need to restart the kernel to use updated packages.
import mysql.connector
import pandas as pd
mydb = mysql.connector.connect(
    host="localhost",
    port="3306",
    user="root",
    password="qB2*JX1ndV#5",
)
cursor = mydb.cursor()
cursor.execute('USE WHR')
WHR_2015 = pd.read_sql('SELECT * FROM Year_2015', con=mydb)
WHR_2015
| Country | Region | Happiness Rank | Happiness Score | Standard Error | Economy (GDP per Capita) | Family | Health (Life Expectancy) | Freedom | Trust (Government Corruption) | Generosity | Dystopia Residual | |
|---|---|---|---|---|---|---|---|---|---|---|---|---|
| 0 | Switzerland | Western Europe | 1 | 7.587 | 0.03411 | 1.39651 | 1.34951 | 0.94143 | 0.66557 | 0.41978 | 0.29678 | 2.51738 |
| 1 | Iceland | Western Europe | 2 | 7.561 | 0.04884 | 1.30232 | 1.40223 | 0.94784 | 0.62877 | 0.14145 | 0.43630 | 2.70201 |
| 2 | Denmark | Western Europe | 3 | 7.527 | 0.03328 | 1.32548 | 1.36058 | 0.87464 | 0.64938 | 0.48357 | 0.34139 | 2.49204 |
| 3 | Norway | Western Europe | 4 | 7.522 | 0.03880 | 1.45900 | 1.33095 | 0.88521 | 0.66973 | 0.36503 | 0.34699 | 2.46531 |
| 4 | Canada | North America | 5 | 7.427 | 0.03553 | 1.32629 | 1.32261 | 0.90563 | 0.63297 | 0.32957 | 0.45811 | 2.45176 |
| ... | ... | ... | ... | ... | ... | ... | ... | ... | ... | ... | ... | ... |
| 153 | Rwanda | Sub-Saharan Africa | 154 | 3.465 | 0.03464 | 0.22208 | 0.77370 | 0.42864 | 0.59201 | 0.55191 | 0.22628 | 0.67042 |
| 154 | Benin | Sub-Saharan Africa | 155 | 3.340 | 0.03656 | 0.28665 | 0.35386 | 0.31910 | 0.48450 | 0.08010 | 0.18260 | 1.63328 |
| 155 | Syria | Middle East and Northern Africa | 156 | 3.006 | 0.05015 | 0.66320 | 0.47489 | 0.72193 | 0.15684 | 0.18906 | 0.47179 | 0.32858 |
| 156 | Burundi | Sub-Saharan Africa | 157 | 2.905 | 0.08658 | 0.01530 | 0.41587 | 0.22396 | 0.11850 | 0.10062 | 0.19727 | 1.83302 |
| 157 | Togo | Sub-Saharan Africa | 158 | 2.839 | 0.06727 | 0.20868 | 0.13995 | 0.28443 | 0.36453 | 0.10731 | 0.16681 | 1.56726 |
158 rows × 12 columns
WHR_2015['Year'] = 2015
WHR_2015 = WHR_2015[['Year', 'Country', 'Region', 'Happiness Rank', 'Happiness Score', 'Economy (GDP per Capita)', 'Family', 'Health (Life Expectancy)', 'Freedom', 'Trust (Government Corruption)', 'Generosity']]
WHR_2015
| Year | Country | Region | Happiness Rank | Happiness Score | Economy (GDP per Capita) | Family | Health (Life Expectancy) | Freedom | Trust (Government Corruption) | Generosity | |
|---|---|---|---|---|---|---|---|---|---|---|---|
| 0 | 2015 | Switzerland | Western Europe | 1 | 7.587 | 1.39651 | 1.34951 | 0.94143 | 0.66557 | 0.41978 | 0.29678 |
| 1 | 2015 | Iceland | Western Europe | 2 | 7.561 | 1.30232 | 1.40223 | 0.94784 | 0.62877 | 0.14145 | 0.43630 |
| 2 | 2015 | Denmark | Western Europe | 3 | 7.527 | 1.32548 | 1.36058 | 0.87464 | 0.64938 | 0.48357 | 0.34139 |
| 3 | 2015 | Norway | Western Europe | 4 | 7.522 | 1.45900 | 1.33095 | 0.88521 | 0.66973 | 0.36503 | 0.34699 |
| 4 | 2015 | Canada | North America | 5 | 7.427 | 1.32629 | 1.32261 | 0.90563 | 0.63297 | 0.32957 | 0.45811 |
| ... | ... | ... | ... | ... | ... | ... | ... | ... | ... | ... | ... |
| 153 | 2015 | Rwanda | Sub-Saharan Africa | 154 | 3.465 | 0.22208 | 0.77370 | 0.42864 | 0.59201 | 0.55191 | 0.22628 |
| 154 | 2015 | Benin | Sub-Saharan Africa | 155 | 3.340 | 0.28665 | 0.35386 | 0.31910 | 0.48450 | 0.08010 | 0.18260 |
| 155 | 2015 | Syria | Middle East and Northern Africa | 156 | 3.006 | 0.66320 | 0.47489 | 0.72193 | 0.15684 | 0.18906 | 0.47179 |
| 156 | 2015 | Burundi | Sub-Saharan Africa | 157 | 2.905 | 0.01530 | 0.41587 | 0.22396 | 0.11850 | 0.10062 | 0.19727 |
| 157 | 2015 | Togo | Sub-Saharan Africa | 158 | 2.839 | 0.20868 | 0.13995 | 0.28443 | 0.36453 | 0.10731 | 0.16681 |
158 rows × 11 columns
WHR_2015 = WHR_2015.rename(columns={'Family': 'Social Support', 'Freedom': 'Freedom to Make Life Choices', 'Trust (Government Corruption)': 'Government Corruption'})
WHR_2015
| Year | Country | Region | Happiness Rank | Happiness Score | Economy (GDP per Capita) | Social Support | Health (Life Expectancy) | Freedom to Make Life Choices | Government Corruption | Generosity | |
|---|---|---|---|---|---|---|---|---|---|---|---|
| 0 | 2015 | Switzerland | Western Europe | 1 | 7.587 | 1.39651 | 1.34951 | 0.94143 | 0.66557 | 0.41978 | 0.29678 |
| 1 | 2015 | Iceland | Western Europe | 2 | 7.561 | 1.30232 | 1.40223 | 0.94784 | 0.62877 | 0.14145 | 0.43630 |
| 2 | 2015 | Denmark | Western Europe | 3 | 7.527 | 1.32548 | 1.36058 | 0.87464 | 0.64938 | 0.48357 | 0.34139 |
| 3 | 2015 | Norway | Western Europe | 4 | 7.522 | 1.45900 | 1.33095 | 0.88521 | 0.66973 | 0.36503 | 0.34699 |
| 4 | 2015 | Canada | North America | 5 | 7.427 | 1.32629 | 1.32261 | 0.90563 | 0.63297 | 0.32957 | 0.45811 |
| ... | ... | ... | ... | ... | ... | ... | ... | ... | ... | ... | ... |
| 153 | 2015 | Rwanda | Sub-Saharan Africa | 154 | 3.465 | 0.22208 | 0.77370 | 0.42864 | 0.59201 | 0.55191 | 0.22628 |
| 154 | 2015 | Benin | Sub-Saharan Africa | 155 | 3.340 | 0.28665 | 0.35386 | 0.31910 | 0.48450 | 0.08010 | 0.18260 |
| 155 | 2015 | Syria | Middle East and Northern Africa | 156 | 3.006 | 0.66320 | 0.47489 | 0.72193 | 0.15684 | 0.18906 | 0.47179 |
| 156 | 2015 | Burundi | Sub-Saharan Africa | 157 | 2.905 | 0.01530 | 0.41587 | 0.22396 | 0.11850 | 0.10062 | 0.19727 |
| 157 | 2015 | Togo | Sub-Saharan Africa | 158 | 2.839 | 0.20868 | 0.13995 | 0.28443 | 0.36453 | 0.10731 | 0.16681 |
158 rows × 11 columns
import mysql.connector
import pandas as pd
mydb = mysql.connector.connect(
    host="localhost",
    port="3306",
    user="root",
    password="qB2*JX1ndV#5",
)
cursor = mydb.cursor()
cursor.execute('USE WHR')
WHR_2016 = pd.read_sql('SELECT * FROM Year_2016', con=mydb)
WHR_2016
| Country | Region | Happiness Rank | Happiness Score | Lower Confidence Interval | Upper Confidence Interval | Economy (GDP per Capita) | Family | Health (Life Expectancy) | Freedom | Trust (Government Corruption) | Generosity | Dystopia Residual | |
|---|---|---|---|---|---|---|---|---|---|---|---|---|---|
| 0 | Denmark | Western Europe | 1 | 7.526 | 7.460 | 7.592 | 1.44178 | 1.16374 | 0.79504 | 0.57941 | 0.44453 | 0.36171 | 2.73939 |
| 1 | Switzerland | Western Europe | 2 | 7.509 | 7.428 | 7.590 | 1.52733 | 1.14524 | 0.86303 | 0.58557 | 0.41203 | 0.28083 | 2.69463 |
| 2 | Iceland | Western Europe | 3 | 7.501 | 7.333 | 7.669 | 1.42666 | 1.18326 | 0.86733 | 0.56624 | 0.14975 | 0.47678 | 2.83137 |
| 3 | Norway | Western Europe | 4 | 7.498 | 7.421 | 7.575 | 1.57744 | 1.12690 | 0.79579 | 0.59609 | 0.35776 | 0.37895 | 2.66465 |
| 4 | Finland | Western Europe | 5 | 7.413 | 7.351 | 7.475 | 1.40598 | 1.13464 | 0.81091 | 0.57104 | 0.41004 | 0.25492 | 2.82596 |
| ... | ... | ... | ... | ... | ... | ... | ... | ... | ... | ... | ... | ... | ... |
| 152 | Benin | Sub-Saharan Africa | 153 | 3.484 | 3.404 | 3.564 | 0.39499 | 0.10419 | 0.21028 | 0.39747 | 0.06681 | 0.20180 | 2.10812 |
| 153 | Afghanistan | Southern Asia | 154 | 3.360 | 3.288 | 3.432 | 0.38227 | 0.11037 | 0.17344 | 0.16430 | 0.07112 | 0.31268 | 2.14558 |
| 154 | Togo | Sub-Saharan Africa | 155 | 3.303 | 3.192 | 3.414 | 0.28123 | 0.00000 | 0.24811 | 0.34678 | 0.11587 | 0.17517 | 2.13540 |
| 155 | Syria | Middle East and Northern Africa | 156 | 3.069 | 2.936 | 3.202 | 0.74719 | 0.14866 | 0.62994 | 0.06912 | 0.17233 | 0.48397 | 0.81789 |
| 156 | Burundi | Sub-Saharan Africa | 157 | 2.905 | 2.732 | 3.078 | 0.06831 | 0.23442 | 0.15747 | 0.04320 | 0.09419 | 0.20290 | 2.10404 |
157 rows × 13 columns
WHR_2016['Year'] = 2016
WHR_2016 = WHR_2016[['Year', 'Country', 'Region', 'Happiness Rank', 'Happiness Score', 'Economy (GDP per Capita)', 'Family', 'Health (Life Expectancy)', 'Freedom', 'Trust (Government Corruption)', 'Generosity']]
WHR_2016
| Year | Country | Region | Happiness Rank | Happiness Score | Economy (GDP per Capita) | Family | Health (Life Expectancy) | Freedom | Trust (Government Corruption) | Generosity | |
|---|---|---|---|---|---|---|---|---|---|---|---|
| 0 | 2016 | Denmark | Western Europe | 1 | 7.526 | 1.44178 | 1.16374 | 0.79504 | 0.57941 | 0.44453 | 0.36171 |
| 1 | 2016 | Switzerland | Western Europe | 2 | 7.509 | 1.52733 | 1.14524 | 0.86303 | 0.58557 | 0.41203 | 0.28083 |
| 2 | 2016 | Iceland | Western Europe | 3 | 7.501 | 1.42666 | 1.18326 | 0.86733 | 0.56624 | 0.14975 | 0.47678 |
| 3 | 2016 | Norway | Western Europe | 4 | 7.498 | 1.57744 | 1.12690 | 0.79579 | 0.59609 | 0.35776 | 0.37895 |
| 4 | 2016 | Finland | Western Europe | 5 | 7.413 | 1.40598 | 1.13464 | 0.81091 | 0.57104 | 0.41004 | 0.25492 |
| ... | ... | ... | ... | ... | ... | ... | ... | ... | ... | ... | ... |
| 152 | 2016 | Benin | Sub-Saharan Africa | 153 | 3.484 | 0.39499 | 0.10419 | 0.21028 | 0.39747 | 0.06681 | 0.20180 |
| 153 | 2016 | Afghanistan | Southern Asia | 154 | 3.360 | 0.38227 | 0.11037 | 0.17344 | 0.16430 | 0.07112 | 0.31268 |
| 154 | 2016 | Togo | Sub-Saharan Africa | 155 | 3.303 | 0.28123 | 0.00000 | 0.24811 | 0.34678 | 0.11587 | 0.17517 |
| 155 | 2016 | Syria | Middle East and Northern Africa | 156 | 3.069 | 0.74719 | 0.14866 | 0.62994 | 0.06912 | 0.17233 | 0.48397 |
| 156 | 2016 | Burundi | Sub-Saharan Africa | 157 | 2.905 | 0.06831 | 0.23442 | 0.15747 | 0.04320 | 0.09419 | 0.20290 |
157 rows × 11 columns
WHR_2016 = WHR_2016.rename(columns={'Family': 'Social Support', 'Freedom': 'Freedom to Make Life Choices', 'Trust (Government Corruption)': 'Government Corruption'})
WHR_2016
| Year | Country | Region | Happiness Rank | Happiness Score | Economy (GDP per Capita) | Social Support | Health (Life Expectancy) | Freedom to Make Life Choices | Government Corruption | Generosity | |
|---|---|---|---|---|---|---|---|---|---|---|---|
| 0 | 2016 | Denmark | Western Europe | 1 | 7.526 | 1.44178 | 1.16374 | 0.79504 | 0.57941 | 0.44453 | 0.36171 |
| 1 | 2016 | Switzerland | Western Europe | 2 | 7.509 | 1.52733 | 1.14524 | 0.86303 | 0.58557 | 0.41203 | 0.28083 |
| 2 | 2016 | Iceland | Western Europe | 3 | 7.501 | 1.42666 | 1.18326 | 0.86733 | 0.56624 | 0.14975 | 0.47678 |
| 3 | 2016 | Norway | Western Europe | 4 | 7.498 | 1.57744 | 1.12690 | 0.79579 | 0.59609 | 0.35776 | 0.37895 |
| 4 | 2016 | Finland | Western Europe | 5 | 7.413 | 1.40598 | 1.13464 | 0.81091 | 0.57104 | 0.41004 | 0.25492 |
| ... | ... | ... | ... | ... | ... | ... | ... | ... | ... | ... | ... |
| 152 | 2016 | Benin | Sub-Saharan Africa | 153 | 3.484 | 0.39499 | 0.10419 | 0.21028 | 0.39747 | 0.06681 | 0.20180 |
| 153 | 2016 | Afghanistan | Southern Asia | 154 | 3.360 | 0.38227 | 0.11037 | 0.17344 | 0.16430 | 0.07112 | 0.31268 |
| 154 | 2016 | Togo | Sub-Saharan Africa | 155 | 3.303 | 0.28123 | 0.00000 | 0.24811 | 0.34678 | 0.11587 | 0.17517 |
| 155 | 2016 | Syria | Middle East and Northern Africa | 156 | 3.069 | 0.74719 | 0.14866 | 0.62994 | 0.06912 | 0.17233 | 0.48397 |
| 156 | 2016 | Burundi | Sub-Saharan Africa | 157 | 2.905 | 0.06831 | 0.23442 | 0.15747 | 0.04320 | 0.09419 | 0.20290 |
157 rows × 11 columns
import mysql.connector
import pandas as pd
mydb = mysql.connector.connect(
    host="localhost",
    port="3306",
    user="root",
    password="qB2*JX1ndV#5",
)
cursor = mydb.cursor()
cursor.execute('USE WHR')
WHR_2017 = pd.read_sql('SELECT * FROM Year_2017', con=mydb)
WHR_2017
| Country | Happiness.Rank | Happiness.Score | Whisker.high | Whisker.low | Economy..GDP.per.Capita. | Family | Health..Life.Expectancy. | Freedom | Generosity | Trust..Government.Corruption. | Dystopia.Residual | |
|---|---|---|---|---|---|---|---|---|---|---|---|---|
| 0 | Norway | 1 | 7.537 | 7.594445 | 7.479556 | 1.616463 | 1.533524 | 0.796667 | 0.635423 | 0.362012 | 0.315964 | 2.277027 |
| 1 | Denmark | 2 | 7.522 | 7.581728 | 7.462272 | 1.482383 | 1.551122 | 0.792566 | 0.626007 | 0.355280 | 0.400770 | 2.313707 |
| 2 | Iceland | 3 | 7.504 | 7.622030 | 7.385970 | 1.480633 | 1.610574 | 0.833552 | 0.627163 | 0.475540 | 0.153527 | 2.322715 |
| 3 | Switzerland | 4 | 7.494 | 7.561772 | 7.426227 | 1.564980 | 1.516912 | 0.858131 | 0.620071 | 0.290549 | 0.367007 | 2.276716 |
| 4 | Finland | 5 | 7.469 | 7.527542 | 7.410458 | 1.443572 | 1.540247 | 0.809158 | 0.617951 | 0.245483 | 0.382612 | 2.430182 |
| ... | ... | ... | ... | ... | ... | ... | ... | ... | ... | ... | ... | ... |
| 150 | Rwanda | 151 | 3.471 | 3.543030 | 3.398970 | 0.368746 | 0.945707 | 0.326425 | 0.581844 | 0.252756 | 0.455220 | 0.540061 |
| 151 | Syria | 152 | 3.462 | 3.663669 | 3.260331 | 0.777153 | 0.396103 | 0.500533 | 0.081539 | 0.493664 | 0.151347 | 1.061574 |
| 152 | Tanzania | 153 | 3.349 | 3.461430 | 3.236570 | 0.511136 | 1.041990 | 0.364509 | 0.390018 | 0.354256 | 0.066035 | 0.621130 |
| 153 | Burundi | 154 | 2.905 | 3.074690 | 2.735310 | 0.091623 | 0.629794 | 0.151611 | 0.059901 | 0.204435 | 0.084148 | 1.683024 |
| 154 | Central African Republic | 155 | 2.693 | 2.864884 | 2.521116 | 0.000000 | 0.000000 | 0.018773 | 0.270842 | 0.280876 | 0.056565 | 2.066005 |
155 rows × 12 columns
WHR_2017['Year'] = 2017
WHR_2017 = WHR_2017[['Year', 'Country', 'Happiness.Rank', 'Happiness.Score', 'Economy..GDP.per.Capita.', 'Family', 'Health..Life.Expectancy.', 'Freedom', 'Trust..Government.Corruption.', 'Generosity']]
WHR_2017
| Year | Country | Happiness.Rank | Happiness.Score | Economy..GDP.per.Capita. | Family | Health..Life.Expectancy. | Freedom | Trust..Government.Corruption. | Generosity | |
|---|---|---|---|---|---|---|---|---|---|---|
| 0 | 2017 | Norway | 1 | 7.537 | 1.616463 | 1.533524 | 0.796667 | 0.635423 | 0.315964 | 0.362012 |
| 1 | 2017 | Denmark | 2 | 7.522 | 1.482383 | 1.551122 | 0.792566 | 0.626007 | 0.400770 | 0.355280 |
| 2 | 2017 | Iceland | 3 | 7.504 | 1.480633 | 1.610574 | 0.833552 | 0.627163 | 0.153527 | 0.475540 |
| 3 | 2017 | Switzerland | 4 | 7.494 | 1.564980 | 1.516912 | 0.858131 | 0.620071 | 0.367007 | 0.290549 |
| 4 | 2017 | Finland | 5 | 7.469 | 1.443572 | 1.540247 | 0.809158 | 0.617951 | 0.382612 | 0.245483 |
| ... | ... | ... | ... | ... | ... | ... | ... | ... | ... | ... |
| 150 | 2017 | Rwanda | 151 | 3.471 | 0.368746 | 0.945707 | 0.326425 | 0.581844 | 0.455220 | 0.252756 |
| 151 | 2017 | Syria | 152 | 3.462 | 0.777153 | 0.396103 | 0.500533 | 0.081539 | 0.151347 | 0.493664 |
| 152 | 2017 | Tanzania | 153 | 3.349 | 0.511136 | 1.041990 | 0.364509 | 0.390018 | 0.066035 | 0.354256 |
| 153 | 2017 | Burundi | 154 | 2.905 | 0.091623 | 0.629794 | 0.151611 | 0.059901 | 0.084148 | 0.204435 |
| 154 | 2017 | Central African Republic | 155 | 2.693 | 0.000000 | 0.000000 | 0.018773 | 0.270842 | 0.056565 | 0.280876 |
155 rows × 10 columns
WHR_2017 = WHR_2017.rename(columns={'Happiness.Rank': 'Happiness Rank', 'Happiness.Score': 'Happiness Score', 'Economy..GDP.per.Capita.': 'Economy (GDP per Capita)', 'Family': 'Social Support', 'Health..Life.Expectancy.': 'Health (Life Expectancy)', 'Freedom': 'Freedom to Make Life Choices', 'Trust..Government.Corruption.': 'Government Corruption'})
WHR_2017
| Year | Country | Happiness Rank | Happiness Score | Economy (GDP per Capita) | Social Support | Health (Life Expectancy) | Freedom to Make Life Choices | Government Corruption | Generosity | |
|---|---|---|---|---|---|---|---|---|---|---|
| 0 | 2017 | Norway | 1 | 7.537 | 1.616463 | 1.533524 | 0.796667 | 0.635423 | 0.315964 | 0.362012 |
| 1 | 2017 | Denmark | 2 | 7.522 | 1.482383 | 1.551122 | 0.792566 | 0.626007 | 0.400770 | 0.355280 |
| 2 | 2017 | Iceland | 3 | 7.504 | 1.480633 | 1.610574 | 0.833552 | 0.627163 | 0.153527 | 0.475540 |
| 3 | 2017 | Switzerland | 4 | 7.494 | 1.564980 | 1.516912 | 0.858131 | 0.620071 | 0.367007 | 0.290549 |
| 4 | 2017 | Finland | 5 | 7.469 | 1.443572 | 1.540247 | 0.809158 | 0.617951 | 0.382612 | 0.245483 |
| ... | ... | ... | ... | ... | ... | ... | ... | ... | ... | ... |
| 150 | 2017 | Rwanda | 151 | 3.471 | 0.368746 | 0.945707 | 0.326425 | 0.581844 | 0.455220 | 0.252756 |
| 151 | 2017 | Syria | 152 | 3.462 | 0.777153 | 0.396103 | 0.500533 | 0.081539 | 0.151347 | 0.493664 |
| 152 | 2017 | Tanzania | 153 | 3.349 | 0.511136 | 1.041990 | 0.364509 | 0.390018 | 0.066035 | 0.354256 |
| 153 | 2017 | Burundi | 154 | 2.905 | 0.091623 | 0.629794 | 0.151611 | 0.059901 | 0.084148 | 0.204435 |
| 154 | 2017 | Central African Republic | 155 | 2.693 | 0.000000 | 0.000000 | 0.018773 | 0.270842 | 0.056565 | 0.280876 |
155 rows × 10 columns
country_and_region = WHR_2016[['Country', 'Region']]
country_and_region
| Country | Region | |
|---|---|---|
| 0 | Denmark | Western Europe |
| 1 | Switzerland | Western Europe |
| 2 | Iceland | Western Europe |
| 3 | Norway | Western Europe |
| 4 | Finland | Western Europe |
| ... | ... | ... |
| 152 | Benin | Sub-Saharan Africa |
| 153 | Afghanistan | Southern Asia |
| 154 | Togo | Sub-Saharan Africa |
| 155 | Syria | Middle East and Northern Africa |
| 156 | Burundi | Sub-Saharan Africa |
157 rows × 2 columns
WHR_2017 = pd.merge(WHR_2017, country_and_region, on=['Country'])
WHR_2017
| Year | Country | Happiness Rank | Happiness Score | Economy (GDP per Capita) | Social Support | Health (Life Expectancy) | Freedom to Make Life Choices | Government Corruption | Generosity | Region | |
|---|---|---|---|---|---|---|---|---|---|---|---|
| 0 | 2017 | Norway | 1 | 7.537 | 1.616463 | 1.533524 | 0.796667 | 0.635423 | 0.315964 | 0.362012 | Western Europe |
| 1 | 2017 | Denmark | 2 | 7.522 | 1.482383 | 1.551122 | 0.792566 | 0.626007 | 0.400770 | 0.355280 | Western Europe |
| 2 | 2017 | Iceland | 3 | 7.504 | 1.480633 | 1.610574 | 0.833552 | 0.627163 | 0.153527 | 0.475540 | Western Europe |
| 3 | 2017 | Switzerland | 4 | 7.494 | 1.564980 | 1.516912 | 0.858131 | 0.620071 | 0.367007 | 0.290549 | Western Europe |
| 4 | 2017 | Finland | 5 | 7.469 | 1.443572 | 1.540247 | 0.809158 | 0.617951 | 0.382612 | 0.245483 | Western Europe |
| ... | ... | ... | ... | ... | ... | ... | ... | ... | ... | ... | ... |
| 145 | 2017 | Togo | 150 | 3.495 | 0.305445 | 0.431883 | 0.247106 | 0.380426 | 0.095665 | 0.196896 | Sub-Saharan Africa |
| 146 | 2017 | Rwanda | 151 | 3.471 | 0.368746 | 0.945707 | 0.326425 | 0.581844 | 0.455220 | 0.252756 | Sub-Saharan Africa |
| 147 | 2017 | Syria | 152 | 3.462 | 0.777153 | 0.396103 | 0.500533 | 0.081539 | 0.151347 | 0.493664 | Middle East and Northern Africa |
| 148 | 2017 | Tanzania | 153 | 3.349 | 0.511136 | 1.041990 | 0.364509 | 0.390018 | 0.066035 | 0.354256 | Sub-Saharan Africa |
| 149 | 2017 | Burundi | 154 | 2.905 | 0.091623 | 0.629794 | 0.151611 | 0.059901 | 0.084148 | 0.204435 | Sub-Saharan Africa |
150 rows × 11 columns
WHR_2017 = WHR_2017[['Year', 'Country', 'Region', 'Happiness Rank', 'Happiness Score', 'Economy (GDP per Capita)', 'Social Support', 'Health (Life Expectancy)', 'Freedom to Make Life Choices', 'Government Corruption', 'Generosity']]
WHR_2017
| Year | Country | Region | Happiness Rank | Happiness Score | Economy (GDP per Capita) | Social Support | Health (Life Expectancy) | Freedom to Make Life Choices | Government Corruption | Generosity | |
|---|---|---|---|---|---|---|---|---|---|---|---|
| 0 | 2017 | Norway | Western Europe | 1 | 7.537 | 1.616463 | 1.533524 | 0.796667 | 0.635423 | 0.315964 | 0.362012 |
| 1 | 2017 | Denmark | Western Europe | 2 | 7.522 | 1.482383 | 1.551122 | 0.792566 | 0.626007 | 0.400770 | 0.355280 |
| 2 | 2017 | Iceland | Western Europe | 3 | 7.504 | 1.480633 | 1.610574 | 0.833552 | 0.627163 | 0.153527 | 0.475540 |
| 3 | 2017 | Switzerland | Western Europe | 4 | 7.494 | 1.564980 | 1.516912 | 0.858131 | 0.620071 | 0.367007 | 0.290549 |
| 4 | 2017 | Finland | Western Europe | 5 | 7.469 | 1.443572 | 1.540247 | 0.809158 | 0.617951 | 0.382612 | 0.245483 |
| ... | ... | ... | ... | ... | ... | ... | ... | ... | ... | ... | ... |
| 145 | 2017 | Togo | Sub-Saharan Africa | 150 | 3.495 | 0.305445 | 0.431883 | 0.247106 | 0.380426 | 0.095665 | 0.196896 |
| 146 | 2017 | Rwanda | Sub-Saharan Africa | 151 | 3.471 | 0.368746 | 0.945707 | 0.326425 | 0.581844 | 0.455220 | 0.252756 |
| 147 | 2017 | Syria | Middle East and Northern Africa | 152 | 3.462 | 0.777153 | 0.396103 | 0.500533 | 0.081539 | 0.151347 | 0.493664 |
| 148 | 2017 | Tanzania | Sub-Saharan Africa | 153 | 3.349 | 0.511136 | 1.041990 | 0.364509 | 0.390018 | 0.066035 | 0.354256 |
| 149 | 2017 | Burundi | Sub-Saharan Africa | 154 | 2.905 | 0.091623 | 0.629794 | 0.151611 | 0.059901 | 0.084148 | 0.204435 |
150 rows × 11 columns
import mysql.connector
import pandas as pd
mydb = mysql.connector.connect(
    host="localhost",
    port="3306",
    user="root",
    password="qB2*JX1ndV#5",
)
cursor = mydb.cursor()
cursor.execute('USE WHR')
WHR_2018 = pd.read_sql('SELECT * FROM Year_2018', con=mydb)
WHR_2018
| Overall rank | Country or region | Score | GDP per capita | Social support | Healthy life expectancy | Freedom to make life choices | Generosity | Perceptions of corruption | |
|---|---|---|---|---|---|---|---|---|---|
| 0 | 1 | Finland | 7.632 | 1.305 | 1.592 | 0.874 | 0.681 | 0.202 | 0.393 |
| 1 | 2 | Norway | 7.594 | 1.456 | 1.582 | 0.861 | 0.686 | 0.286 | 0.340 |
| 2 | 3 | Denmark | 7.555 | 1.351 | 1.590 | 0.868 | 0.683 | 0.284 | 0.408 |
| 3 | 4 | Iceland | 7.495 | 1.343 | 1.644 | 0.914 | 0.677 | 0.353 | 0.138 |
| 4 | 5 | Switzerland | 7.487 | 1.420 | 1.549 | 0.927 | 0.660 | 0.256 | 0.357 |
| ... | ... | ... | ... | ... | ... | ... | ... | ... | ... |
| 150 | 152 | Yemen | 3.355 | 0.442 | 1.073 | 0.343 | 0.244 | 0.083 | 0.064 |
| 151 | 153 | Tanzania | 3.303 | 0.455 | 0.991 | 0.381 | 0.481 | 0.270 | 0.097 |
| 152 | 154 | South Sudan | 3.254 | 0.337 | 0.608 | 0.177 | 0.112 | 0.224 | 0.106 |
| 153 | 155 | Central African Republic | 3.083 | 0.024 | 0.000 | 0.010 | 0.305 | 0.218 | 0.038 |
| 154 | 156 | Burundi | 2.905 | 0.091 | 0.627 | 0.145 | 0.065 | 0.149 | 0.076 |
155 rows × 9 columns
WHR_2018['Year'] = 2018
WHR_2018 = WHR_2018[['Year', 'Country or region', 'Overall rank', 'Score', 'GDP per capita', 'Social support', 'Healthy life expectancy', 'Freedom to make life choices', 'Perceptions of corruption', 'Generosity']]
WHR_2018
| Year | Country or region | Overall rank | Score | GDP per capita | Social support | Healthy life expectancy | Freedom to make life choices | Perceptions of corruption | Generosity | |
|---|---|---|---|---|---|---|---|---|---|---|
| 0 | 2018 | Finland | 1 | 7.632 | 1.305 | 1.592 | 0.874 | 0.681 | 0.393 | 0.202 |
| 1 | 2018 | Norway | 2 | 7.594 | 1.456 | 1.582 | 0.861 | 0.686 | 0.340 | 0.286 |
| 2 | 2018 | Denmark | 3 | 7.555 | 1.351 | 1.590 | 0.868 | 0.683 | 0.408 | 0.284 |
| 3 | 2018 | Iceland | 4 | 7.495 | 1.343 | 1.644 | 0.914 | 0.677 | 0.138 | 0.353 |
| 4 | 2018 | Switzerland | 5 | 7.487 | 1.420 | 1.549 | 0.927 | 0.660 | 0.357 | 0.256 |
| ... | ... | ... | ... | ... | ... | ... | ... | ... | ... | ... |
| 150 | 2018 | Yemen | 152 | 3.355 | 0.442 | 1.073 | 0.343 | 0.244 | 0.064 | 0.083 |
| 151 | 2018 | Tanzania | 153 | 3.303 | 0.455 | 0.991 | 0.381 | 0.481 | 0.097 | 0.270 |
| 152 | 2018 | South Sudan | 154 | 3.254 | 0.337 | 0.608 | 0.177 | 0.112 | 0.106 | 0.224 |
| 153 | 2018 | Central African Republic | 155 | 3.083 | 0.024 | 0.000 | 0.010 | 0.305 | 0.038 | 0.218 |
| 154 | 2018 | Burundi | 156 | 2.905 | 0.091 | 0.627 | 0.145 | 0.065 | 0.076 | 0.149 |
155 rows × 10 columns
WHR_2018 = WHR_2018.rename(columns={'Country or region': 'Country', 'Overall rank': 'Happiness Rank', 'Score': 'Happiness Score', 'GDP per capita': 'Economy (GDP per Capita)', 'Social support': 'Social Support', 'Healthy life expectancy': 'Health (Life Expectancy)', 'Freedom to make life choices': 'Freedom to Make Life Choices', 'Perceptions of corruption': 'Government Corruption'})
WHR_2018
| Year | Country | Happiness Rank | Happiness Score | Economy (GDP per Capita) | Social Support | Health (Life Expectancy) | Freedom to Make Life Choices | Government Corruption | Generosity | |
|---|---|---|---|---|---|---|---|---|---|---|
| 0 | 2018 | Finland | 1 | 7.632 | 1.305 | 1.592 | 0.874 | 0.681 | 0.393 | 0.202 |
| 1 | 2018 | Norway | 2 | 7.594 | 1.456 | 1.582 | 0.861 | 0.686 | 0.340 | 0.286 |
| 2 | 2018 | Denmark | 3 | 7.555 | 1.351 | 1.590 | 0.868 | 0.683 | 0.408 | 0.284 |
| 3 | 2018 | Iceland | 4 | 7.495 | 1.343 | 1.644 | 0.914 | 0.677 | 0.138 | 0.353 |
| 4 | 2018 | Switzerland | 5 | 7.487 | 1.420 | 1.549 | 0.927 | 0.660 | 0.357 | 0.256 |
| ... | ... | ... | ... | ... | ... | ... | ... | ... | ... | ... |
| 150 | 2018 | Yemen | 152 | 3.355 | 0.442 | 1.073 | 0.343 | 0.244 | 0.064 | 0.083 |
| 151 | 2018 | Tanzania | 153 | 3.303 | 0.455 | 0.991 | 0.381 | 0.481 | 0.097 | 0.270 |
| 152 | 2018 | South Sudan | 154 | 3.254 | 0.337 | 0.608 | 0.177 | 0.112 | 0.106 | 0.224 |
| 153 | 2018 | Central African Republic | 155 | 3.083 | 0.024 | 0.000 | 0.010 | 0.305 | 0.038 | 0.218 |
| 154 | 2018 | Burundi | 156 | 2.905 | 0.091 | 0.627 | 0.145 | 0.065 | 0.076 | 0.149 |
155 rows × 10 columns
WHR_2018 = pd.merge(WHR_2018, country_and_region, on=['Country'])
WHR_2018
| Year | Country | Happiness Rank | Happiness Score | Economy (GDP per Capita) | Social Support | Health (Life Expectancy) | Freedom to Make Life Choices | Government Corruption | Generosity | Region | |
|---|---|---|---|---|---|---|---|---|---|---|---|
| 0 | 2018 | Finland | 1 | 7.632 | 1.305 | 1.592 | 0.874 | 0.681 | 0.393 | 0.202 | Western Europe |
| 1 | 2018 | Norway | 2 | 7.594 | 1.456 | 1.582 | 0.861 | 0.686 | 0.340 | 0.286 | Western Europe |
| 2 | 2018 | Denmark | 3 | 7.555 | 1.351 | 1.590 | 0.868 | 0.683 | 0.408 | 0.284 | Western Europe |
| 3 | 2018 | Iceland | 4 | 7.495 | 1.343 | 1.644 | 0.914 | 0.677 | 0.138 | 0.353 | Western Europe |
| 4 | 2018 | Switzerland | 5 | 7.487 | 1.420 | 1.549 | 0.927 | 0.660 | 0.357 | 0.256 | Western Europe |
| ... | ... | ... | ... | ... | ... | ... | ... | ... | ... | ... | ... |
| 145 | 2018 | Rwanda | 151 | 3.408 | 0.332 | 0.896 | 0.400 | 0.636 | 0.444 | 0.200 | Sub-Saharan Africa |
| 146 | 2018 | Yemen | 152 | 3.355 | 0.442 | 1.073 | 0.343 | 0.244 | 0.064 | 0.083 | Middle East and Northern Africa |
| 147 | 2018 | Tanzania | 153 | 3.303 | 0.455 | 0.991 | 0.381 | 0.481 | 0.097 | 0.270 | Sub-Saharan Africa |
| 148 | 2018 | South Sudan | 154 | 3.254 | 0.337 | 0.608 | 0.177 | 0.112 | 0.106 | 0.224 | Sub-Saharan Africa |
| 149 | 2018 | Burundi | 156 | 2.905 | 0.091 | 0.627 | 0.145 | 0.065 | 0.076 | 0.149 | Sub-Saharan Africa |
150 rows × 11 columns
WHR_2018 = WHR_2018[['Year', 'Country', 'Region', 'Happiness Rank', 'Happiness Score', 'Economy (GDP per Capita)', 'Social Support', 'Health (Life Expectancy)', 'Freedom to Make Life Choices', 'Government Corruption', 'Generosity']]
WHR_2018
| Year | Country | Region | Happiness Rank | Happiness Score | Economy (GDP per Capita) | Social Support | Health (Life Expectancy) | Freedom to Make Life Choices | Government Corruption | Generosity | |
|---|---|---|---|---|---|---|---|---|---|---|---|
| 0 | 2018 | Finland | Western Europe | 1 | 7.632 | 1.305 | 1.592 | 0.874 | 0.681 | 0.393 | 0.202 |
| 1 | 2018 | Norway | Western Europe | 2 | 7.594 | 1.456 | 1.582 | 0.861 | 0.686 | 0.340 | 0.286 |
| 2 | 2018 | Denmark | Western Europe | 3 | 7.555 | 1.351 | 1.590 | 0.868 | 0.683 | 0.408 | 0.284 |
| 3 | 2018 | Iceland | Western Europe | 4 | 7.495 | 1.343 | 1.644 | 0.914 | 0.677 | 0.138 | 0.353 |
| 4 | 2018 | Switzerland | Western Europe | 5 | 7.487 | 1.420 | 1.549 | 0.927 | 0.660 | 0.357 | 0.256 |
| ... | ... | ... | ... | ... | ... | ... | ... | ... | ... | ... | ... |
| 145 | 2018 | Rwanda | Sub-Saharan Africa | 151 | 3.408 | 0.332 | 0.896 | 0.400 | 0.636 | 0.444 | 0.200 |
| 146 | 2018 | Yemen | Middle East and Northern Africa | 152 | 3.355 | 0.442 | 1.073 | 0.343 | 0.244 | 0.064 | 0.083 |
| 147 | 2018 | Tanzania | Sub-Saharan Africa | 153 | 3.303 | 0.455 | 0.991 | 0.381 | 0.481 | 0.097 | 0.270 |
| 148 | 2018 | South Sudan | Sub-Saharan Africa | 154 | 3.254 | 0.337 | 0.608 | 0.177 | 0.112 | 0.106 | 0.224 |
| 149 | 2018 | Burundi | Sub-Saharan Africa | 156 | 2.905 | 0.091 | 0.627 | 0.145 | 0.065 | 0.076 | 0.149 |
150 rows × 11 columns
import mysql.connector
import pandas as pd
mydb = mysql.connector.connect(
    host="localhost",
    port="3306",
    user="root",
    password="qB2*JX1ndV#5",
)
cursor = mydb.cursor()
cursor.execute('USE WHR')
WHR_2019 = pd.read_sql('SELECT * FROM Year_2019', con=mydb)
WHR_2019
| Overall rank | Country or region | Score | GDP per capita | Social support | Healthy life expectancy | Freedom to make life choices | Generosity | Perceptions of corruption | |
|---|---|---|---|---|---|---|---|---|---|
| 0 | 1 | Finland | 7.769 | 1.340 | 1.587 | 0.986 | 0.596 | 0.153 | 0.393 |
| 1 | 2 | Denmark | 7.600 | 1.383 | 1.573 | 0.996 | 0.592 | 0.252 | 0.410 |
| 2 | 3 | Norway | 7.554 | 1.488 | 1.582 | 1.028 | 0.603 | 0.271 | 0.341 |
| 3 | 4 | Iceland | 7.494 | 1.380 | 1.624 | 1.026 | 0.591 | 0.354 | 0.118 |
| 4 | 5 | Netherlands | 7.488 | 1.396 | 1.522 | 0.999 | 0.557 | 0.322 | 0.298 |
| ... | ... | ... | ... | ... | ... | ... | ... | ... | ... |
| 151 | 152 | Rwanda | 3.334 | 0.359 | 0.711 | 0.614 | 0.555 | 0.217 | 0.411 |
| 152 | 153 | Tanzania | 3.231 | 0.476 | 0.885 | 0.499 | 0.417 | 0.276 | 0.147 |
| 153 | 154 | Afghanistan | 3.203 | 0.350 | 0.517 | 0.361 | 0.000 | 0.158 | 0.025 |
| 154 | 155 | Central African Republic | 3.083 | 0.026 | 0.000 | 0.105 | 0.225 | 0.235 | 0.035 |
| 155 | 156 | South Sudan | 2.853 | 0.306 | 0.575 | 0.295 | 0.010 | 0.202 | 0.091 |
156 rows × 9 columns
WHR_2019['Year'] = 2019
WHR_2019 = WHR_2019[['Year', 'Country or region', 'Overall rank', 'Score', 'GDP per capita', 'Social support', 'Healthy life expectancy', 'Freedom to make life choices', 'Perceptions of corruption', 'Generosity']]
WHR_2019
| Year | Country or region | Overall rank | Score | GDP per capita | Social support | Healthy life expectancy | Freedom to make life choices | Perceptions of corruption | Generosity | |
|---|---|---|---|---|---|---|---|---|---|---|
| 0 | 2019 | Finland | 1 | 7.769 | 1.340 | 1.587 | 0.986 | 0.596 | 0.393 | 0.153 |
| 1 | 2019 | Denmark | 2 | 7.600 | 1.383 | 1.573 | 0.996 | 0.592 | 0.410 | 0.252 |
| 2 | 2019 | Norway | 3 | 7.554 | 1.488 | 1.582 | 1.028 | 0.603 | 0.341 | 0.271 |
| 3 | 2019 | Iceland | 4 | 7.494 | 1.380 | 1.624 | 1.026 | 0.591 | 0.118 | 0.354 |
| 4 | 2019 | Netherlands | 5 | 7.488 | 1.396 | 1.522 | 0.999 | 0.557 | 0.298 | 0.322 |
| ... | ... | ... | ... | ... | ... | ... | ... | ... | ... | ... |
| 151 | 2019 | Rwanda | 152 | 3.334 | 0.359 | 0.711 | 0.614 | 0.555 | 0.411 | 0.217 |
| 152 | 2019 | Tanzania | 153 | 3.231 | 0.476 | 0.885 | 0.499 | 0.417 | 0.147 | 0.276 |
| 153 | 2019 | Afghanistan | 154 | 3.203 | 0.350 | 0.517 | 0.361 | 0.000 | 0.025 | 0.158 |
| 154 | 2019 | Central African Republic | 155 | 3.083 | 0.026 | 0.000 | 0.105 | 0.225 | 0.035 | 0.235 |
| 155 | 2019 | South Sudan | 156 | 2.853 | 0.306 | 0.575 | 0.295 | 0.010 | 0.091 | 0.202 |
156 rows × 10 columns
WHR_2019 = WHR_2019.rename(columns={'Country or region': 'Country', 'Overall rank': 'Happiness Rank', 'Score': 'Happiness Score', 'GDP per capita': 'Economy (GDP per Capita)', 'Social support': 'Social Support', 'Healthy life expectancy': 'Health (Life Expectancy)', 'Freedom to make life choices': 'Freedom to Make Life Choices', 'Perceptions of corruption': 'Government Corruption'})
WHR_2019
| Year | Country | Happiness Rank | Happiness Score | Economy (GDP per Capita) | Social Support | Health (Life Expectancy) | Freedom to Make Life Choices | Government Corruption | Generosity | |
|---|---|---|---|---|---|---|---|---|---|---|
| 0 | 2019 | Finland | 1 | 7.769 | 1.340 | 1.587 | 0.986 | 0.596 | 0.393 | 0.153 |
| 1 | 2019 | Denmark | 2 | 7.600 | 1.383 | 1.573 | 0.996 | 0.592 | 0.410 | 0.252 |
| 2 | 2019 | Norway | 3 | 7.554 | 1.488 | 1.582 | 1.028 | 0.603 | 0.341 | 0.271 |
| 3 | 2019 | Iceland | 4 | 7.494 | 1.380 | 1.624 | 1.026 | 0.591 | 0.118 | 0.354 |
| 4 | 2019 | Netherlands | 5 | 7.488 | 1.396 | 1.522 | 0.999 | 0.557 | 0.298 | 0.322 |
| ... | ... | ... | ... | ... | ... | ... | ... | ... | ... | ... |
| 151 | 2019 | Rwanda | 152 | 3.334 | 0.359 | 0.711 | 0.614 | 0.555 | 0.411 | 0.217 |
| 152 | 2019 | Tanzania | 153 | 3.231 | 0.476 | 0.885 | 0.499 | 0.417 | 0.147 | 0.276 |
| 153 | 2019 | Afghanistan | 154 | 3.203 | 0.350 | 0.517 | 0.361 | 0.000 | 0.025 | 0.158 |
| 154 | 2019 | Central African Republic | 155 | 3.083 | 0.026 | 0.000 | 0.105 | 0.225 | 0.035 | 0.235 |
| 155 | 2019 | South Sudan | 156 | 2.853 | 0.306 | 0.575 | 0.295 | 0.010 | 0.091 | 0.202 |
156 rows × 10 columns
WHR_2019 = pd.merge(WHR_2019, country_and_region, on=['Country'])
WHR_2019
| Year | Country | Happiness Rank | Happiness Score | Economy (GDP per Capita) | Social Support | Health (Life Expectancy) | Freedom to Make Life Choices | Government Corruption | Generosity | Region | |
|---|---|---|---|---|---|---|---|---|---|---|---|
| 0 | 2019 | Finland | 1 | 7.769 | 1.340 | 1.587 | 0.986 | 0.596 | 0.393 | 0.153 | Western Europe |
| 1 | 2019 | Denmark | 2 | 7.600 | 1.383 | 1.573 | 0.996 | 0.592 | 0.410 | 0.252 | Western Europe |
| 2 | 2019 | Norway | 3 | 7.554 | 1.488 | 1.582 | 1.028 | 0.603 | 0.341 | 0.271 | Western Europe |
| 3 | 2019 | Iceland | 4 | 7.494 | 1.380 | 1.624 | 1.026 | 0.591 | 0.118 | 0.354 | Western Europe |
| 4 | 2019 | Netherlands | 5 | 7.488 | 1.396 | 1.522 | 0.999 | 0.557 | 0.298 | 0.322 | Western Europe |
| ... | ... | ... | ... | ... | ... | ... | ... | ... | ... | ... | ... |
| 143 | 2019 | Yemen | 151 | 3.380 | 0.287 | 1.163 | 0.463 | 0.143 | 0.077 | 0.108 | Middle East and Northern Africa |
| 144 | 2019 | Rwanda | 152 | 3.334 | 0.359 | 0.711 | 0.614 | 0.555 | 0.411 | 0.217 | Sub-Saharan Africa |
| 145 | 2019 | Tanzania | 153 | 3.231 | 0.476 | 0.885 | 0.499 | 0.417 | 0.147 | 0.276 | Sub-Saharan Africa |
| 146 | 2019 | Afghanistan | 154 | 3.203 | 0.350 | 0.517 | 0.361 | 0.000 | 0.025 | 0.158 | Southern Asia |
| 147 | 2019 | South Sudan | 156 | 2.853 | 0.306 | 0.575 | 0.295 | 0.010 | 0.091 | 0.202 | Sub-Saharan Africa |
148 rows × 11 columns
WHR_2019 = WHR_2019[['Year', 'Country', 'Region', 'Happiness Rank', 'Happiness Score', 'Economy (GDP per Capita)', 'Social Support', 'Health (Life Expectancy)', 'Freedom to Make Life Choices', 'Government Corruption', 'Generosity']]
WHR_2019
| Year | Country | Region | Happiness Rank | Happiness Score | Economy (GDP per Capita) | Social Support | Health (Life Expectancy) | Freedom to Make Life Choices | Government Corruption | Generosity | |
|---|---|---|---|---|---|---|---|---|---|---|---|
| 0 | 2019 | Finland | Western Europe | 1 | 7.769 | 1.340 | 1.587 | 0.986 | 0.596 | 0.393 | 0.153 |
| 1 | 2019 | Denmark | Western Europe | 2 | 7.600 | 1.383 | 1.573 | 0.996 | 0.592 | 0.410 | 0.252 |
| 2 | 2019 | Norway | Western Europe | 3 | 7.554 | 1.488 | 1.582 | 1.028 | 0.603 | 0.341 | 0.271 |
| 3 | 2019 | Iceland | Western Europe | 4 | 7.494 | 1.380 | 1.624 | 1.026 | 0.591 | 0.118 | 0.354 |
| 4 | 2019 | Netherlands | Western Europe | 5 | 7.488 | 1.396 | 1.522 | 0.999 | 0.557 | 0.298 | 0.322 |
| ... | ... | ... | ... | ... | ... | ... | ... | ... | ... | ... | ... |
| 143 | 2019 | Yemen | Middle East and Northern Africa | 151 | 3.380 | 0.287 | 1.163 | 0.463 | 0.143 | 0.077 | 0.108 |
| 144 | 2019 | Rwanda | Sub-Saharan Africa | 152 | 3.334 | 0.359 | 0.711 | 0.614 | 0.555 | 0.411 | 0.217 |
| 145 | 2019 | Tanzania | Sub-Saharan Africa | 153 | 3.231 | 0.476 | 0.885 | 0.499 | 0.417 | 0.147 | 0.276 |
| 146 | 2019 | Afghanistan | Southern Asia | 154 | 3.203 | 0.350 | 0.517 | 0.361 | 0.000 | 0.025 | 0.158 |
| 147 | 2019 | South Sudan | Sub-Saharan Africa | 156 | 2.853 | 0.306 | 0.575 | 0.295 | 0.010 | 0.091 | 0.202 |
148 rows × 11 columns
WHR = pd.concat([WHR_2015, WHR_2016, WHR_2017, WHR_2018, WHR_2019])
WHR
| Year | Country | Region | Happiness Rank | Happiness Score | Economy (GDP per Capita) | Social Support | Health (Life Expectancy) | Freedom to Make Life Choices | Government Corruption | Generosity | |
|---|---|---|---|---|---|---|---|---|---|---|---|
| 0 | 2015 | Switzerland | Western Europe | 1 | 7.587 | 1.39651 | 1.34951 | 0.94143 | 0.66557 | 0.41978 | 0.29678 |
| 1 | 2015 | Iceland | Western Europe | 2 | 7.561 | 1.30232 | 1.40223 | 0.94784 | 0.62877 | 0.14145 | 0.43630 |
| 2 | 2015 | Denmark | Western Europe | 3 | 7.527 | 1.32548 | 1.36058 | 0.87464 | 0.64938 | 0.48357 | 0.34139 |
| 3 | 2015 | Norway | Western Europe | 4 | 7.522 | 1.45900 | 1.33095 | 0.88521 | 0.66973 | 0.36503 | 0.34699 |
| 4 | 2015 | Canada | North America | 5 | 7.427 | 1.32629 | 1.32261 | 0.90563 | 0.63297 | 0.32957 | 0.45811 |
| ... | ... | ... | ... | ... | ... | ... | ... | ... | ... | ... | ... |
| 143 | 2019 | Yemen | Middle East and Northern Africa | 151 | 3.380 | 0.28700 | 1.16300 | 0.46300 | 0.14300 | 0.07700 | 0.10800 |
| 144 | 2019 | Rwanda | Sub-Saharan Africa | 152 | 3.334 | 0.35900 | 0.71100 | 0.61400 | 0.55500 | 0.41100 | 0.21700 |
| 145 | 2019 | Tanzania | Sub-Saharan Africa | 153 | 3.231 | 0.47600 | 0.88500 | 0.49900 | 0.41700 | 0.14700 | 0.27600 |
| 146 | 2019 | Afghanistan | Southern Asia | 154 | 3.203 | 0.35000 | 0.51700 | 0.36100 | 0.00000 | 0.02500 | 0.15800 |
| 147 | 2019 | South Sudan | Sub-Saharan Africa | 156 | 2.853 | 0.30600 | 0.57500 | 0.29500 | 0.01000 | 0.09100 | 0.20200 |
763 rows × 11 columns
import mysql.connector
import pandas as pd
mydb = mysql.connector.connect(
    host="localhost",
    port="3306",
    user="root",
    password="qB2*JX1ndV#5",
)
cursor = mydb.cursor()
cursor.execute('USE HDI')
HDI = pd.read_sql('SELECT * FROM HDI', con=mydb)
HDI
| Country | ISO_Code | Level | GDLCODE | Region | 2015 | 2016 | 2017 | 2018 | 2019 | |
|---|---|---|---|---|---|---|---|---|---|---|
| 0 | Country | ISO_Code | Level | GDLCODE | Region | 2015.000 | 2016.000 | 2017.000 | 2018.000 | 2019.000 |
| 1 | Afghanistan | AFG | National | AFGt | Total | 0.499 | 0.502 | 0.506 | 0.509 | 0.511 |
| 2 | Albania | ALB | National | ALBt | Total | 0.787 | 0.787 | 0.790 | 0.793 | 0.794 |
| 3 | Algeria | DZA | National | DZAt | Total | 0.739 | 0.742 | 0.746 | 0.747 | 0.748 |
| 4 | Andorra | AND | National | ANDt | Total | 0.862 | 0.866 | 0.863 | 0.867 | 0.868 |
| ... | ... | ... | ... | ... | ... | ... | ... | ... | ... | ... |
| 181 | Venezuela | VEN | National | VENt | Total | 0.770 | 0.759 | 0.742 | 0.732 | 0.711 |
| 182 | Vietnam | VNM | National | VNMt | Total | 0.689 | 0.694 | 0.696 | 0.700 | 0.704 |
| 183 | Yemen | YEM | National | YEMt | Total | 0.484 | 0.474 | 0.467 | 0.468 | 0.470 |
| 184 | Zambia | ZMB | National | ZMBt | Total | 0.569 | 0.572 | 0.578 | 0.582 | 0.585 |
| 185 | Zimbabwe | ZWE | National | ZWEt | Total | 0.552 | 0.558 | 0.563 | 0.570 | 0.571 |
186 rows × 10 columns
HDI_2015 = HDI.loc[1:187, ['Country', '2015']]
HDI_2015 = HDI_2015.rename(columns = {'2015': 'HDI Score'})
HDI_2015['Year'] = 2015
HDI_2015
| Country | HDI Score | Year | |
|---|---|---|---|
| 1 | Afghanistan | 0.499 | 2015 |
| 2 | Albania | 0.787 | 2015 |
| 3 | Algeria | 0.739 | 2015 |
| 4 | Andorra | 0.862 | 2015 |
| 5 | Angola | 0.572 | 2015 |
| ... | ... | ... | ... |
| 181 | Venezuela | 0.770 | 2015 |
| 182 | Vietnam | 0.689 | 2015 |
| 183 | Yemen | 0.484 | 2015 |
| 184 | Zambia | 0.569 | 2015 |
| 185 | Zimbabwe | 0.552 | 2015 |
185 rows × 3 columns
WHR = WHR.set_index(['Year', 'Country'])
WHR
| Region | Happiness Rank | Happiness Score | Economy (GDP per Capita) | Social Support | Health (Life Expectancy) | Freedom to Make Life Choices | Government Corruption | Generosity | ||
|---|---|---|---|---|---|---|---|---|---|---|
| Year | Country | |||||||||
| 2015 | Switzerland | Western Europe | 1 | 7.587 | 1.39651 | 1.34951 | 0.94143 | 0.66557 | 0.41978 | 0.29678 |
| Iceland | Western Europe | 2 | 7.561 | 1.30232 | 1.40223 | 0.94784 | 0.62877 | 0.14145 | 0.43630 | |
| Denmark | Western Europe | 3 | 7.527 | 1.32548 | 1.36058 | 0.87464 | 0.64938 | 0.48357 | 0.34139 | |
| Norway | Western Europe | 4 | 7.522 | 1.45900 | 1.33095 | 0.88521 | 0.66973 | 0.36503 | 0.34699 | |
| Canada | North America | 5 | 7.427 | 1.32629 | 1.32261 | 0.90563 | 0.63297 | 0.32957 | 0.45811 | |
| ... | ... | ... | ... | ... | ... | ... | ... | ... | ... | ... |
| 2019 | Yemen | Middle East and Northern Africa | 151 | 3.380 | 0.28700 | 1.16300 | 0.46300 | 0.14300 | 0.07700 | 0.10800 |
| Rwanda | Sub-Saharan Africa | 152 | 3.334 | 0.35900 | 0.71100 | 0.61400 | 0.55500 | 0.41100 | 0.21700 | |
| Tanzania | Sub-Saharan Africa | 153 | 3.231 | 0.47600 | 0.88500 | 0.49900 | 0.41700 | 0.14700 | 0.27600 | |
| Afghanistan | Southern Asia | 154 | 3.203 | 0.35000 | 0.51700 | 0.36100 | 0.00000 | 0.02500 | 0.15800 | |
| South Sudan | Sub-Saharan Africa | 156 | 2.853 | 0.30600 | 0.57500 | 0.29500 | 0.01000 | 0.09100 | 0.20200 |
763 rows × 9 columns
HDI_2015_Index = HDI_2015.set_index(['Year', 'Country'])
HDI_2015_Index
| HDI Score | ||
|---|---|---|
| Year | Country | |
| 2015 | Afghanistan | 0.499 |
| Albania | 0.787 | |
| Algeria | 0.739 | |
| Andorra | 0.862 | |
| Angola | 0.572 | |
| ... | ... | |
| Venezuela | 0.770 | |
| Vietnam | 0.689 | |
| Yemen | 0.484 | |
| Zambia | 0.569 | |
| Zimbabwe | 0.552 |
185 rows × 1 columns
WHR_HDI = WHR.join(HDI_2015_Index)
WHR_HDI
| Region | Happiness Rank | Happiness Score | Economy (GDP per Capita) | Social Support | Health (Life Expectancy) | Freedom to Make Life Choices | Government Corruption | Generosity | HDI Score | ||
|---|---|---|---|---|---|---|---|---|---|---|---|
| Year | Country | ||||||||||
| 2015 | Switzerland | Western Europe | 1 | 7.587 | 1.39651 | 1.34951 | 0.94143 | 0.66557 | 0.41978 | 0.29678 | 0.948 |
| Iceland | Western Europe | 2 | 7.561 | 1.30232 | 1.40223 | 0.94784 | 0.62877 | 0.14145 | 0.43630 | 0.934 | |
| Denmark | Western Europe | 3 | 7.527 | 1.32548 | 1.36058 | 0.87464 | 0.64938 | 0.48357 | 0.34139 | 0.933 | |
| Norway | Western Europe | 4 | 7.522 | 1.45900 | 1.33095 | 0.88521 | 0.66973 | 0.36503 | 0.34699 | 0.947 | |
| Canada | North America | 5 | 7.427 | 1.32629 | 1.32261 | 0.90563 | 0.63297 | 0.32957 | 0.45811 | 0.920 | |
| ... | ... | ... | ... | ... | ... | ... | ... | ... | ... | ... | ... |
| 2019 | Yemen | Middle East and Northern Africa | 151 | 3.380 | 0.28700 | 1.16300 | 0.46300 | 0.14300 | 0.07700 | 0.10800 | NaN |
| Rwanda | Sub-Saharan Africa | 152 | 3.334 | 0.35900 | 0.71100 | 0.61400 | 0.55500 | 0.41100 | 0.21700 | NaN | |
| Tanzania | Sub-Saharan Africa | 153 | 3.231 | 0.47600 | 0.88500 | 0.49900 | 0.41700 | 0.14700 | 0.27600 | NaN | |
| Afghanistan | Southern Asia | 154 | 3.203 | 0.35000 | 0.51700 | 0.36100 | 0.00000 | 0.02500 | 0.15800 | NaN | |
| South Sudan | Sub-Saharan Africa | 156 | 2.853 | 0.30600 | 0.57500 | 0.29500 | 0.01000 | 0.09100 | 0.20200 | NaN |
763 rows × 10 columns
WHR_HDI_2015 = WHR_HDI.dropna()
WHR_HDI_2015
| Region | Happiness Rank | Happiness Score | Economy (GDP per Capita) | Social Support | Health (Life Expectancy) | Freedom to Make Life Choices | Government Corruption | Generosity | HDI Score | ||
|---|---|---|---|---|---|---|---|---|---|---|---|
| Year | Country | ||||||||||
| 2015 | Switzerland | Western Europe | 1 | 7.587 | 1.39651 | 1.34951 | 0.94143 | 0.66557 | 0.41978 | 0.29678 | 0.948 |
| Iceland | Western Europe | 2 | 7.561 | 1.30232 | 1.40223 | 0.94784 | 0.62877 | 0.14145 | 0.43630 | 0.934 | |
| Denmark | Western Europe | 3 | 7.527 | 1.32548 | 1.36058 | 0.87464 | 0.64938 | 0.48357 | 0.34139 | 0.933 | |
| Norway | Western Europe | 4 | 7.522 | 1.45900 | 1.33095 | 0.88521 | 0.66973 | 0.36503 | 0.34699 | 0.947 | |
| Canada | North America | 5 | 7.427 | 1.32629 | 1.32261 | 0.90563 | 0.63297 | 0.32957 | 0.45811 | 0.920 | |
| ... | ... | ... | ... | ... | ... | ... | ... | ... | ... | ... | |
| Afghanistan | Southern Asia | 153 | 3.575 | 0.31982 | 0.30285 | 0.30335 | 0.23414 | 0.09719 | 0.36510 | 0.499 | |
| Rwanda | Sub-Saharan Africa | 154 | 3.465 | 0.22208 | 0.77370 | 0.42864 | 0.59201 | 0.55191 | 0.22628 | 0.526 | |
| Benin | Sub-Saharan Africa | 155 | 3.340 | 0.28665 | 0.35386 | 0.31910 | 0.48450 | 0.08010 | 0.18260 | 0.532 | |
| Burundi | Sub-Saharan Africa | 157 | 2.905 | 0.01530 | 0.41587 | 0.22396 | 0.11850 | 0.10062 | 0.19727 | 0.437 | |
| Togo | Sub-Saharan Africa | 158 | 2.839 | 0.20868 | 0.13995 | 0.28443 | 0.36453 | 0.10731 | 0.16681 | 0.500 |
140 rows × 10 columns
HDI_2016 = HDI.loc[1:187, ['Country', '2016']]
HDI_2016 = HDI_2016.rename(columns = {'2016': 'HDI Score'})
HDI_2016['Year'] = 2016
HDI_2016
| Country | HDI Score | Year | |
|---|---|---|---|
| 1 | Afghanistan | 0.502 | 2016 |
| 2 | Albania | 0.787 | 2016 |
| 3 | Algeria | 0.742 | 2016 |
| 4 | Andorra | 0.866 | 2016 |
| 5 | Angola | 0.578 | 2016 |
| ... | ... | ... | ... |
| 181 | Venezuela | 0.759 | 2016 |
| 182 | Vietnam | 0.694 | 2016 |
| 183 | Yemen | 0.474 | 2016 |
| 184 | Zambia | 0.572 | 2016 |
| 185 | Zimbabwe | 0.558 | 2016 |
185 rows × 3 columns
HDI_2016_Index = HDI_2016.set_index(['Year', 'Country'])
HDI_2016_Index
| HDI Score | ||
|---|---|---|
| Year | Country | |
| 2016 | Afghanistan | 0.502 |
| Albania | 0.787 | |
| Algeria | 0.742 | |
| Andorra | 0.866 | |
| Angola | 0.578 | |
| ... | ... | |
| Venezuela | 0.759 | |
| Vietnam | 0.694 | |
| Yemen | 0.474 | |
| Zambia | 0.572 | |
| Zimbabwe | 0.558 |
185 rows × 1 columns
WHR_HDI = WHR.join(HDI_2016_Index)
WHR_HDI
| Region | Happiness Rank | Happiness Score | Economy (GDP per Capita) | Social Support | Health (Life Expectancy) | Freedom to Make Life Choices | Government Corruption | Generosity | HDI Score | ||
|---|---|---|---|---|---|---|---|---|---|---|---|
| Year | Country | ||||||||||
| 2015 | Switzerland | Western Europe | 1 | 7.587 | 1.39651 | 1.34951 | 0.94143 | 0.66557 | 0.41978 | 0.29678 | NaN |
| Iceland | Western Europe | 2 | 7.561 | 1.30232 | 1.40223 | 0.94784 | 0.62877 | 0.14145 | 0.43630 | NaN | |
| Denmark | Western Europe | 3 | 7.527 | 1.32548 | 1.36058 | 0.87464 | 0.64938 | 0.48357 | 0.34139 | NaN | |
| Norway | Western Europe | 4 | 7.522 | 1.45900 | 1.33095 | 0.88521 | 0.66973 | 0.36503 | 0.34699 | NaN | |
| Canada | North America | 5 | 7.427 | 1.32629 | 1.32261 | 0.90563 | 0.63297 | 0.32957 | 0.45811 | NaN | |
| ... | ... | ... | ... | ... | ... | ... | ... | ... | ... | ... | ... |
| 2019 | Yemen | Middle East and Northern Africa | 151 | 3.380 | 0.28700 | 1.16300 | 0.46300 | 0.14300 | 0.07700 | 0.10800 | NaN |
| Rwanda | Sub-Saharan Africa | 152 | 3.334 | 0.35900 | 0.71100 | 0.61400 | 0.55500 | 0.41100 | 0.21700 | NaN | |
| Tanzania | Sub-Saharan Africa | 153 | 3.231 | 0.47600 | 0.88500 | 0.49900 | 0.41700 | 0.14700 | 0.27600 | NaN | |
| Afghanistan | Southern Asia | 154 | 3.203 | 0.35000 | 0.51700 | 0.36100 | 0.00000 | 0.02500 | 0.15800 | NaN | |
| South Sudan | Sub-Saharan Africa | 156 | 2.853 | 0.30600 | 0.57500 | 0.29500 | 0.01000 | 0.09100 | 0.20200 | NaN |
763 rows × 10 columns
WHR_HDI_2016 = WHR_HDI.dropna()
WHR_HDI_2016
| Region | Happiness Rank | Happiness Score | Economy (GDP per Capita) | Social Support | Health (Life Expectancy) | Freedom to Make Life Choices | Government Corruption | Generosity | HDI Score | ||
|---|---|---|---|---|---|---|---|---|---|---|---|
| Year | Country | ||||||||||
| 2016 | Denmark | Western Europe | 1 | 7.526 | 1.44178 | 1.16374 | 0.79504 | 0.57941 | 0.44453 | 0.36171 | 0.935 |
| Switzerland | Western Europe | 2 | 7.509 | 1.52733 | 1.14524 | 0.86303 | 0.58557 | 0.41203 | 0.28083 | 0.947 | |
| Iceland | Western Europe | 3 | 7.501 | 1.42666 | 1.18326 | 0.86733 | 0.56624 | 0.14975 | 0.47678 | 0.941 | |
| Norway | Western Europe | 4 | 7.498 | 1.57744 | 1.12690 | 0.79579 | 0.59609 | 0.35776 | 0.37895 | 0.950 | |
| Finland | Western Europe | 5 | 7.413 | 1.40598 | 1.13464 | 0.81091 | 0.57104 | 0.41004 | 0.25492 | 0.932 | |
| ... | ... | ... | ... | ... | ... | ... | ... | ... | ... | ... | |
| Rwanda | Sub-Saharan Africa | 152 | 3.515 | 0.32846 | 0.61586 | 0.31865 | 0.54320 | 0.50521 | 0.23552 | 0.527 | |
| Benin | Sub-Saharan Africa | 153 | 3.484 | 0.39499 | 0.10419 | 0.21028 | 0.39747 | 0.06681 | 0.20180 | 0.532 | |
| Afghanistan | Southern Asia | 154 | 3.360 | 0.38227 | 0.11037 | 0.17344 | 0.16430 | 0.07112 | 0.31268 | 0.502 | |
| Togo | Sub-Saharan Africa | 155 | 3.303 | 0.28123 | 0.00000 | 0.24811 | 0.34678 | 0.11587 | 0.17517 | 0.501 | |
| Burundi | Sub-Saharan Africa | 157 | 2.905 | 0.06831 | 0.23442 | 0.15747 | 0.04320 | 0.09419 | 0.20290 | 0.438 |
140 rows × 10 columns
HDI_2017 = HDI.loc[1:187, ['Country', '2017']]
HDI_2017 = HDI_2017.rename(columns = {'2017': 'HDI Score'})
HDI_2017['Year'] = 2017
HDI_2017
| Country | HDI Score | Year | |
|---|---|---|---|
| 1 | Afghanistan | 0.506 | 2017 |
| 2 | Albania | 0.790 | 2017 |
| 3 | Algeria | 0.746 | 2017 |
| 4 | Andorra | 0.863 | 2017 |
| 5 | Angola | 0.582 | 2017 |
| ... | ... | ... | ... |
| 181 | Venezuela | 0.742 | 2017 |
| 182 | Vietnam | 0.696 | 2017 |
| 183 | Yemen | 0.467 | 2017 |
| 184 | Zambia | 0.578 | 2017 |
| 185 | Zimbabwe | 0.563 | 2017 |
185 rows × 3 columns
HDI_2017_Index = HDI_2017.set_index(['Year', 'Country'])
HDI_2017_Index
| HDI Score | ||
|---|---|---|
| Year | Country | |
| 2017 | Afghanistan | 0.506 |
| Albania | 0.790 | |
| Algeria | 0.746 | |
| Andorra | 0.863 | |
| Angola | 0.582 | |
| ... | ... | |
| Venezuela | 0.742 | |
| Vietnam | 0.696 | |
| Yemen | 0.467 | |
| Zambia | 0.578 | |
| Zimbabwe | 0.563 |
185 rows × 1 columns
WHR_HDI = WHR.join(HDI_2017_Index)
WHR_HDI
| Region | Happiness Rank | Happiness Score | Economy (GDP per Capita) | Social Support | Health (Life Expectancy) | Freedom to Make Life Choices | Government Corruption | Generosity | HDI Score | ||
|---|---|---|---|---|---|---|---|---|---|---|---|
| Year | Country | ||||||||||
| 2015 | Switzerland | Western Europe | 1 | 7.587 | 1.39651 | 1.34951 | 0.94143 | 0.66557 | 0.41978 | 0.29678 | NaN |
| Iceland | Western Europe | 2 | 7.561 | 1.30232 | 1.40223 | 0.94784 | 0.62877 | 0.14145 | 0.43630 | NaN | |
| Denmark | Western Europe | 3 | 7.527 | 1.32548 | 1.36058 | 0.87464 | 0.64938 | 0.48357 | 0.34139 | NaN | |
| Norway | Western Europe | 4 | 7.522 | 1.45900 | 1.33095 | 0.88521 | 0.66973 | 0.36503 | 0.34699 | NaN | |
| Canada | North America | 5 | 7.427 | 1.32629 | 1.32261 | 0.90563 | 0.63297 | 0.32957 | 0.45811 | NaN | |
| ... | ... | ... | ... | ... | ... | ... | ... | ... | ... | ... | ... |
| 2019 | Yemen | Middle East and Northern Africa | 151 | 3.380 | 0.28700 | 1.16300 | 0.46300 | 0.14300 | 0.07700 | 0.10800 | NaN |
| Rwanda | Sub-Saharan Africa | 152 | 3.334 | 0.35900 | 0.71100 | 0.61400 | 0.55500 | 0.41100 | 0.21700 | NaN | |
| Tanzania | Sub-Saharan Africa | 153 | 3.231 | 0.47600 | 0.88500 | 0.49900 | 0.41700 | 0.14700 | 0.27600 | NaN | |
| Afghanistan | Southern Asia | 154 | 3.203 | 0.35000 | 0.51700 | 0.36100 | 0.00000 | 0.02500 | 0.15800 | NaN | |
| South Sudan | Sub-Saharan Africa | 156 | 2.853 | 0.30600 | 0.57500 | 0.29500 | 0.01000 | 0.09100 | 0.20200 | NaN |
763 rows × 10 columns
WHR_HDI_2017 = WHR_HDI.dropna()
WHR_HDI_2017
| Region | Happiness Rank | Happiness Score | Economy (GDP per Capita) | Social Support | Health (Life Expectancy) | Freedom to Make Life Choices | Government Corruption | Generosity | HDI Score | ||
|---|---|---|---|---|---|---|---|---|---|---|---|
| Year | Country | ||||||||||
| 2017 | Norway | Western Europe | 1 | 7.537 | 1.616463 | 1.533524 | 0.796667 | 0.635423 | 0.315964 | 0.362012 | 0.954 |
| Denmark | Western Europe | 2 | 7.522 | 1.482383 | 1.551122 | 0.792566 | 0.626007 | 0.400770 | 0.355280 | 0.937 | |
| Iceland | Western Europe | 3 | 7.504 | 1.480633 | 1.610574 | 0.833552 | 0.627163 | 0.153527 | 0.475540 | 0.943 | |
| Switzerland | Western Europe | 4 | 7.494 | 1.564980 | 1.516912 | 0.858131 | 0.620071 | 0.367007 | 0.290549 | 0.948 | |
| Finland | Western Europe | 5 | 7.469 | 1.443572 | 1.540247 | 0.809158 | 0.617951 | 0.382612 | 0.245483 | 0.935 | |
| ... | ... | ... | ... | ... | ... | ... | ... | ... | ... | ... | |
| Guinea | Sub-Saharan Africa | 149 | 3.507 | 0.244550 | 0.791245 | 0.194129 | 0.348588 | 0.110938 | 0.264815 | 0.472 | |
| Togo | Sub-Saharan Africa | 150 | 3.495 | 0.305445 | 0.431883 | 0.247106 | 0.380426 | 0.095665 | 0.196896 | 0.506 | |
| Rwanda | Sub-Saharan Africa | 151 | 3.471 | 0.368746 | 0.945707 | 0.326425 | 0.581844 | 0.455220 | 0.252756 | 0.535 | |
| Tanzania | Sub-Saharan Africa | 153 | 3.349 | 0.511136 | 1.041990 | 0.364509 | 0.390018 | 0.066035 | 0.354256 | 0.523 | |
| Burundi | Sub-Saharan Africa | 154 | 2.905 | 0.091623 | 0.629794 | 0.151611 | 0.059901 | 0.084148 | 0.204435 | 0.434 |
138 rows × 10 columns
HDI_2018 = HDI.loc[1:187, ['Country', '2018']]
HDI_2018 = HDI_2018.rename(columns = {'2018': 'HDI Score'})
HDI_2018['Year'] = 2018
HDI_2018
| Country | HDI Score | Year | |
|---|---|---|---|
| 1 | Afghanistan | 0.509 | 2018 |
| 2 | Albania | 0.793 | 2018 |
| 3 | Algeria | 0.747 | 2018 |
| 4 | Andorra | 0.867 | 2018 |
| 5 | Angola | 0.582 | 2018 |
| ... | ... | ... | ... |
| 181 | Venezuela | 0.732 | 2018 |
| 182 | Vietnam | 0.700 | 2018 |
| 183 | Yemen | 0.468 | 2018 |
| 184 | Zambia | 0.582 | 2018 |
| 185 | Zimbabwe | 0.570 | 2018 |
185 rows × 3 columns
HDI_2018_Index = HDI_2018.set_index(['Year', 'Country'])
HDI_2018_Index
| HDI Score | ||
|---|---|---|
| Year | Country | |
| 2018 | Afghanistan | 0.509 |
| Albania | 0.793 | |
| Algeria | 0.747 | |
| Andorra | 0.867 | |
| Angola | 0.582 | |
| ... | ... | |
| Venezuela | 0.732 | |
| Vietnam | 0.700 | |
| Yemen | 0.468 | |
| Zambia | 0.582 | |
| Zimbabwe | 0.570 |
185 rows × 1 columns
WHR_HDI = WHR.join(HDI_2018_Index)
WHR_HDI
| Region | Happiness Rank | Happiness Score | Economy (GDP per Capita) | Social Support | Health (Life Expectancy) | Freedom to Make Life Choices | Government Corruption | Generosity | HDI Score | ||
|---|---|---|---|---|---|---|---|---|---|---|---|
| Year | Country | ||||||||||
| 2015 | Switzerland | Western Europe | 1 | 7.587 | 1.39651 | 1.34951 | 0.94143 | 0.66557 | 0.41978 | 0.29678 | NaN |
| Iceland | Western Europe | 2 | 7.561 | 1.30232 | 1.40223 | 0.94784 | 0.62877 | 0.14145 | 0.43630 | NaN | |
| Denmark | Western Europe | 3 | 7.527 | 1.32548 | 1.36058 | 0.87464 | 0.64938 | 0.48357 | 0.34139 | NaN | |
| Norway | Western Europe | 4 | 7.522 | 1.45900 | 1.33095 | 0.88521 | 0.66973 | 0.36503 | 0.34699 | NaN | |
| Canada | North America | 5 | 7.427 | 1.32629 | 1.32261 | 0.90563 | 0.63297 | 0.32957 | 0.45811 | NaN | |
| ... | ... | ... | ... | ... | ... | ... | ... | ... | ... | ... | ... |
| 2019 | Yemen | Middle East and Northern Africa | 151 | 3.380 | 0.28700 | 1.16300 | 0.46300 | 0.14300 | 0.07700 | 0.10800 | NaN |
| Rwanda | Sub-Saharan Africa | 152 | 3.334 | 0.35900 | 0.71100 | 0.61400 | 0.55500 | 0.41100 | 0.21700 | NaN | |
| Tanzania | Sub-Saharan Africa | 153 | 3.231 | 0.47600 | 0.88500 | 0.49900 | 0.41700 | 0.14700 | 0.27600 | NaN | |
| Afghanistan | Southern Asia | 154 | 3.203 | 0.35000 | 0.51700 | 0.36100 | 0.00000 | 0.02500 | 0.15800 | NaN | |
| South Sudan | Sub-Saharan Africa | 156 | 2.853 | 0.30600 | 0.57500 | 0.29500 | 0.01000 | 0.09100 | 0.20200 | NaN |
763 rows × 10 columns
WHR_HDI_2018 = WHR_HDI.dropna()
WHR_HDI_2018
| Region | Happiness Rank | Happiness Score | Economy (GDP per Capita) | Social Support | Health (Life Expectancy) | Freedom to Make Life Choices | Government Corruption | Generosity | HDI Score | ||
|---|---|---|---|---|---|---|---|---|---|---|---|
| Year | Country | ||||||||||
| 2018 | Finland | Western Europe | 1 | 7.632 | 1.305 | 1.592 | 0.874 | 0.681 | 0.393 | 0.202 | 0.936 |
| Norway | Western Europe | 2 | 7.594 | 1.456 | 1.582 | 0.861 | 0.686 | 0.340 | 0.286 | 0.955 | |
| Denmark | Western Europe | 3 | 7.555 | 1.351 | 1.590 | 0.868 | 0.683 | 0.408 | 0.284 | 0.938 | |
| Iceland | Western Europe | 4 | 7.495 | 1.343 | 1.644 | 0.914 | 0.677 | 0.138 | 0.353 | 0.946 | |
| Switzerland | Western Europe | 5 | 7.487 | 1.420 | 1.549 | 0.927 | 0.660 | 0.357 | 0.256 | 0.954 | |
| ... | ... | ... | ... | ... | ... | ... | ... | ... | ... | ... | |
| Rwanda | Sub-Saharan Africa | 151 | 3.408 | 0.332 | 0.896 | 0.400 | 0.636 | 0.444 | 0.200 | 0.539 | |
| Yemen | Middle East and Northern Africa | 152 | 3.355 | 0.442 | 1.073 | 0.343 | 0.244 | 0.064 | 0.083 | 0.468 | |
| Tanzania | Sub-Saharan Africa | 153 | 3.303 | 0.455 | 0.991 | 0.381 | 0.481 | 0.097 | 0.270 | 0.524 | |
| South Sudan | Sub-Saharan Africa | 154 | 3.254 | 0.337 | 0.608 | 0.177 | 0.112 | 0.106 | 0.224 | 0.428 | |
| Burundi | Sub-Saharan Africa | 156 | 2.905 | 0.091 | 0.627 | 0.145 | 0.065 | 0.076 | 0.149 | 0.431 |
137 rows × 10 columns
HDI_2019 = HDI.loc[1:187, ['Country', '2019']]
HDI_2019 = HDI_2019.rename(columns = {'2019': 'HDI Score'})
HDI_2019['Year'] = 2019
HDI_2019
| Country | HDI Score | Year | |
|---|---|---|---|
| 1 | Afghanistan | 0.511 | 2019 |
| 2 | Albania | 0.794 | 2019 |
| 3 | Algeria | 0.748 | 2019 |
| 4 | Andorra | 0.868 | 2019 |
| 5 | Angola | 0.582 | 2019 |
| ... | ... | ... | ... |
| 181 | Venezuela | 0.711 | 2019 |
| 182 | Vietnam | 0.704 | 2019 |
| 183 | Yemen | 0.470 | 2019 |
| 184 | Zambia | 0.585 | 2019 |
| 185 | Zimbabwe | 0.571 | 2019 |
185 rows × 3 columns
HDI_2019_Index = HDI_2019.set_index(['Year', 'Country'])
HDI_2019_Index
| HDI Score | ||
|---|---|---|
| Year | Country | |
| 2019 | Afghanistan | 0.511 |
| Albania | 0.794 | |
| Algeria | 0.748 | |
| Andorra | 0.868 | |
| Angola | 0.582 | |
| ... | ... | |
| Venezuela | 0.711 | |
| Vietnam | 0.704 | |
| Yemen | 0.470 | |
| Zambia | 0.585 | |
| Zimbabwe | 0.571 |
185 rows × 1 columns
WHR_HDI = WHR.join(HDI_2019_Index)
WHR_HDI
| Region | Happiness Rank | Happiness Score | Economy (GDP per Capita) | Social Support | Health (Life Expectancy) | Freedom to Make Life Choices | Government Corruption | Generosity | HDI Score | ||
|---|---|---|---|---|---|---|---|---|---|---|---|
| Year | Country | ||||||||||
| 2015 | Switzerland | Western Europe | 1 | 7.587 | 1.39651 | 1.34951 | 0.94143 | 0.66557 | 0.41978 | 0.29678 | NaN |
| Iceland | Western Europe | 2 | 7.561 | 1.30232 | 1.40223 | 0.94784 | 0.62877 | 0.14145 | 0.43630 | NaN | |
| Denmark | Western Europe | 3 | 7.527 | 1.32548 | 1.36058 | 0.87464 | 0.64938 | 0.48357 | 0.34139 | NaN | |
| Norway | Western Europe | 4 | 7.522 | 1.45900 | 1.33095 | 0.88521 | 0.66973 | 0.36503 | 0.34699 | NaN | |
| Canada | North America | 5 | 7.427 | 1.32629 | 1.32261 | 0.90563 | 0.63297 | 0.32957 | 0.45811 | NaN | |
| ... | ... | ... | ... | ... | ... | ... | ... | ... | ... | ... | ... |
| 2019 | Yemen | Middle East and Northern Africa | 151 | 3.380 | 0.28700 | 1.16300 | 0.46300 | 0.14300 | 0.07700 | 0.10800 | 0.470 |
| Rwanda | Sub-Saharan Africa | 152 | 3.334 | 0.35900 | 0.71100 | 0.61400 | 0.55500 | 0.41100 | 0.21700 | 0.543 | |
| Tanzania | Sub-Saharan Africa | 153 | 3.231 | 0.47600 | 0.88500 | 0.49900 | 0.41700 | 0.14700 | 0.27600 | 0.528 | |
| Afghanistan | Southern Asia | 154 | 3.203 | 0.35000 | 0.51700 | 0.36100 | 0.00000 | 0.02500 | 0.15800 | 0.511 | |
| South Sudan | Sub-Saharan Africa | 156 | 2.853 | 0.30600 | 0.57500 | 0.29500 | 0.01000 | 0.09100 | 0.20200 | 0.433 |
763 rows × 10 columns
WHR_HDI_2019 = WHR_HDI.dropna()
WHR_HDI_2019
| Region | Happiness Rank | Happiness Score | Economy (GDP per Capita) | Social Support | Health (Life Expectancy) | Freedom to Make Life Choices | Government Corruption | Generosity | HDI Score | ||
|---|---|---|---|---|---|---|---|---|---|---|---|
| Year | Country | ||||||||||
| 2019 | Finland | Western Europe | 1 | 7.769 | 1.340 | 1.587 | 0.986 | 0.596 | 0.393 | 0.153 | 0.938 |
| Denmark | Western Europe | 2 | 7.600 | 1.383 | 1.573 | 0.996 | 0.592 | 0.410 | 0.252 | 0.940 | |
| Norway | Western Europe | 3 | 7.554 | 1.488 | 1.582 | 1.028 | 0.603 | 0.341 | 0.271 | 0.957 | |
| Iceland | Western Europe | 4 | 7.494 | 1.380 | 1.624 | 1.026 | 0.591 | 0.118 | 0.354 | 0.949 | |
| Netherlands | Western Europe | 5 | 7.488 | 1.396 | 1.522 | 0.999 | 0.557 | 0.298 | 0.322 | 0.944 | |
| ... | ... | ... | ... | ... | ... | ... | ... | ... | ... | ... | |
| Yemen | Middle East and Northern Africa | 151 | 3.380 | 0.287 | 1.163 | 0.463 | 0.143 | 0.077 | 0.108 | 0.470 | |
| Rwanda | Sub-Saharan Africa | 152 | 3.334 | 0.359 | 0.711 | 0.614 | 0.555 | 0.411 | 0.217 | 0.543 | |
| Tanzania | Sub-Saharan Africa | 153 | 3.231 | 0.476 | 0.885 | 0.499 | 0.417 | 0.147 | 0.276 | 0.528 | |
| Afghanistan | Southern Asia | 154 | 3.203 | 0.350 | 0.517 | 0.361 | 0.000 | 0.025 | 0.158 | 0.511 | |
| South Sudan | Sub-Saharan Africa | 156 | 2.853 | 0.306 | 0.575 | 0.295 | 0.010 | 0.091 | 0.202 | 0.433 |
136 rows × 10 columns
Final = pd.concat([WHR_HDI_2015, WHR_HDI_2016, WHR_HDI_2017, WHR_HDI_2018, WHR_HDI_2019])
Final = Final.reset_index()
Final = Final.set_index(['Year'])
Final
| Country | Region | Happiness Rank | Happiness Score | Economy (GDP per Capita) | Social Support | Health (Life Expectancy) | Freedom to Make Life Choices | Government Corruption | Generosity | HDI Score | |
|---|---|---|---|---|---|---|---|---|---|---|---|
| Year | |||||||||||
| 2015 | Switzerland | Western Europe | 1 | 7.587 | 1.39651 | 1.34951 | 0.94143 | 0.66557 | 0.41978 | 0.29678 | 0.948 |
| 2015 | Iceland | Western Europe | 2 | 7.561 | 1.30232 | 1.40223 | 0.94784 | 0.62877 | 0.14145 | 0.43630 | 0.934 |
| 2015 | Denmark | Western Europe | 3 | 7.527 | 1.32548 | 1.36058 | 0.87464 | 0.64938 | 0.48357 | 0.34139 | 0.933 |
| 2015 | Norway | Western Europe | 4 | 7.522 | 1.45900 | 1.33095 | 0.88521 | 0.66973 | 0.36503 | 0.34699 | 0.947 |
| 2015 | Canada | North America | 5 | 7.427 | 1.32629 | 1.32261 | 0.90563 | 0.63297 | 0.32957 | 0.45811 | 0.920 |
| ... | ... | ... | ... | ... | ... | ... | ... | ... | ... | ... | ... |
| 2019 | Yemen | Middle East and Northern Africa | 151 | 3.380 | 0.28700 | 1.16300 | 0.46300 | 0.14300 | 0.07700 | 0.10800 | 0.470 |
| 2019 | Rwanda | Sub-Saharan Africa | 152 | 3.334 | 0.35900 | 0.71100 | 0.61400 | 0.55500 | 0.41100 | 0.21700 | 0.543 |
| 2019 | Tanzania | Sub-Saharan Africa | 153 | 3.231 | 0.47600 | 0.88500 | 0.49900 | 0.41700 | 0.14700 | 0.27600 | 0.528 |
| 2019 | Afghanistan | Southern Asia | 154 | 3.203 | 0.35000 | 0.51700 | 0.36100 | 0.00000 | 0.02500 | 0.15800 | 0.511 |
| 2019 | South Sudan | Sub-Saharan Africa | 156 | 2.853 | 0.30600 | 0.57500 | 0.29500 | 0.01000 | 0.09100 | 0.20200 | 0.433 |
691 rows × 11 columns
Final.to_csv('Final Data(WHR_HDI).csv')
It appears that, as Lithuania developed it also showed a positive relationship with its level of happiness:
Final_HS_DS_LT = Final[Final['Country'] == 'Lithuania']
Final_HS_DS_LT = Final_HS_DS_LT[['Happiness Score', 'HDI Score']]
Final_HS_DS_LT
| Happiness Score | HDI Score | |
|---|---|---|
| Year | ||
| 2015 | 5.833 | 0.863 |
| 2016 | 5.813 | 0.868 |
| 2017 | 5.902 | 0.873 |
| 2018 | 5.952 | 0.877 |
| 2019 | 6.149 | 0.882 |
Final_HS_DS_LT.T
| Year | 2015 | 2016 | 2017 | 2018 | 2019 |
|---|---|---|---|---|---|
| Happiness Score | 5.833 | 5.813 | 5.902 | 5.952 | 6.149 |
| HDI Score | 0.863 | 0.868 | 0.873 | 0.877 | 0.882 |
Final_HS_DS_LT.plot(x='HDI Score', y='Happiness Score', title='Lithuania\'s Development and Happiness Between 2015 and 2019')
<AxesSubplot:title={'center':"Lithuania's Development and Happiness Between 2015 and 2019"}, xlabel='HDI Score'>

On Average, between 2015 and 2019 Lithuania scored 5.93 on happiness level and took 52 position in the world:
Final_HS_LT = Final_HS_DS_LT['Happiness Score'].mean()
Final_HS_LT
5.929799990081788
Final_HR_LT = Final[Final['Country'] == 'Lithuania']
Final_HR_LT = Final_HR_LT['Happiness Rank'].mean()
Final_HR_LT
52.0
The average happiness level in Lithuania was 9% higher than the average happiness level of the world:
Final_HS_WD = Final['Happiness Score'].mean()
Final_HS_WD
5.414447177646814
Final_HS_LT / Final_HS_WD * 100 - 100
9.518105829207713
The average happiness in Lithuania was higher than its continental / regional average of 5.42. That is, Lithuania is happier than an averge Cental and Eastern European state, but not quite there to be as happy as an average Western European state:
Final.groupby('Region')['Happiness Score'].mean()
Region
Australia and New Zealand          7.294600
Central and Eastern Europe         5.429362
Eastern Asia                       5.514850
Latin America and Caribbean        5.977690
Middle East and Northern Africa    5.475929
North America                      7.174700
Southeastern Asia                  5.389475
Southern Asia                      4.580657
Sub-Saharan Africa                 4.187880
Western Europe                     6.802768
Name: Happiness Score, dtype: float64
In 2019, Lithuania ranked 42nd by in happiness rank and was almost on par with Uzbekistan, Poland and Slovakia. Only Czech Republic really stands out in the continent/region. With its current happiness level, Czech Republic qualifies to be considered a Western European state:
Final_HS_CEE = WHR_HDI_2019[WHR_HDI_2019['Region'] == 'Central and Eastern Europe'].sort_values(by='Happiness Rank')
Final_HS_CEE
| Region | Happiness Rank | Happiness Score | Economy (GDP per Capita) | Social Support | Health (Life Expectancy) | Freedom to Make Life Choices | Government Corruption | Generosity | HDI Score | ||
|---|---|---|---|---|---|---|---|---|---|---|---|
| Year | Country | ||||||||||
| 2019 | Czech Republic | Central and Eastern Europe | 20 | 6.852 | 1.269 | 1.487 | 0.920 | 0.457 | 0.036 | 0.046 | 0.900 |
| Slovakia | Central and Eastern Europe | 38 | 6.198 | 1.246 | 1.504 | 0.881 | 0.334 | 0.014 | 0.121 | 0.860 | |
| Poland | Central and Eastern Europe | 40 | 6.182 | 1.206 | 1.438 | 0.884 | 0.483 | 0.050 | 0.117 | 0.881 | |
| Uzbekistan | Central and Eastern Europe | 41 | 6.174 | 0.745 | 1.529 | 0.756 | 0.631 | 0.240 | 0.322 | 0.721 | |
| Lithuania | Central and Eastern Europe | 42 | 6.149 | 1.238 | 1.515 | 0.818 | 0.291 | 0.042 | 0.043 | 0.882 | |
| Slovenia | Central and Eastern Europe | 44 | 6.118 | 1.258 | 1.523 | 0.953 | 0.564 | 0.057 | 0.144 | 0.917 | |
| Kosovo | Central and Eastern Europe | 46 | 6.100 | 0.882 | 1.232 | 0.758 | 0.489 | 0.006 | 0.262 | 0.750 | |
| Romania | Central and Eastern Europe | 48 | 6.070 | 1.162 | 1.232 | 0.825 | 0.462 | 0.005 | 0.083 | 0.828 | |
| Latvia | Central and Eastern Europe | 53 | 5.940 | 1.187 | 1.465 | 0.812 | 0.264 | 0.064 | 0.075 | 0.866 | |
| Estonia | Central and Eastern Europe | 55 | 5.893 | 1.237 | 1.528 | 0.874 | 0.495 | 0.161 | 0.103 | 0.892 | |
| Kazakhstan | Central and Eastern Europe | 60 | 5.809 | 1.173 | 1.508 | 0.729 | 0.410 | 0.096 | 0.146 | 0.825 | |
| Hungary | Central and Eastern Europe | 62 | 5.758 | 1.201 | 1.410 | 0.828 | 0.199 | 0.020 | 0.081 | 0.855 | |
| Serbia | Central and Eastern Europe | 70 | 5.603 | 1.004 | 1.383 | 0.854 | 0.282 | 0.039 | 0.137 | 0.806 | |
| Moldova | Central and Eastern Europe | 71 | 5.529 | 0.685 | 1.328 | 0.739 | 0.245 | 0.000 | 0.181 | 0.749 | |
| Tajikistan | Central and Eastern Europe | 74 | 5.467 | 0.493 | 1.098 | 0.718 | 0.389 | 0.144 | 0.230 | 0.668 | |
| Croatia | Central and Eastern Europe | 75 | 5.432 | 1.155 | 1.266 | 0.914 | 0.296 | 0.022 | 0.119 | 0.850 | |
| Bosnia and Herzegovina | Central and Eastern Europe | 78 | 5.386 | 0.945 | 1.212 | 0.845 | 0.212 | 0.006 | 0.263 | 0.780 | |
| Belarus | Central and Eastern Europe | 81 | 5.323 | 1.067 | 1.465 | 0.789 | 0.235 | 0.142 | 0.094 | 0.823 | |
| Kyrgyzstan | Central and Eastern Europe | 86 | 5.261 | 0.551 | 1.438 | 0.723 | 0.508 | 0.023 | 0.300 | 0.698 | |
| Turkmenistan | Central and Eastern Europe | 87 | 5.247 | 1.052 | 1.538 | 0.657 | 0.394 | 0.028 | 0.244 | 0.716 | |
| Azerbaijan | Central and Eastern Europe | 90 | 5.208 | 1.043 | 1.147 | 0.769 | 0.351 | 0.182 | 0.035 | 0.756 | |
| Bulgaria | Central and Eastern Europe | 97 | 5.011 | 1.092 | 1.513 | 0.815 | 0.311 | 0.004 | 0.081 | 0.816 | |
| Albania | Central and Eastern Europe | 107 | 4.719 | 0.947 | 0.848 | 0.874 | 0.383 | 0.027 | 0.178 | 0.794 | |
| Armenia | Central and Eastern Europe | 116 | 4.559 | 0.850 | 1.055 | 0.815 | 0.283 | 0.064 | 0.095 | 0.776 | |
| Georgia | Central and Eastern Europe | 119 | 4.519 | 0.886 | 0.666 | 0.752 | 0.346 | 0.164 | 0.043 | 0.812 | |
| Ukraine | Central and Eastern Europe | 133 | 4.332 | 0.820 | 1.390 | 0.739 | 0.178 | 0.010 | 0.187 | 0.779 |
In the Baltic region, Poland was the happiest state between 2015 and 2019 and Lithuania came in second, leaving behind Latvia and Estonia:
Final_HS_PL = Final[Final['Country'] == 'Poland']
Final_HS_PL['Happiness Score'].mean()
5.980800009918212
Final_HS_LT = Final[Final['Country'] == 'Lithuania']
Final_HS_LT['Happiness Score'].mean()
5.929799990081788
Final_HS_LV = Final[Final['Country'] == 'Latvia']
Final_HS_LV['Happiness Score'].mean()
5.676199980926514
Final_HS_EE = Final[Final['Country'] == 'Estonia']
Final_HS_EE['Happiness Score'].mean()
5.637800012207032
Between 2015 and 2019 Lithuania averaged 0.87 score on human development level:
Final_DS_LT = Final_HS_DS_LT['HDI Score'].mean()
Final_DS_LT
0.8725999999999999
The average human development level in Lithuania was 20% higher than the average human development of the world:
Final_DS_WD = Final['HDI Score'].mean()
Final_DS_WD
0.7269522431259037
Final_DS_LT / Final_DS_WD * 100 - 100
20.035395481800705
The average human development in Lithuania was higher than its continental / regional average of 0.80. That is, Lithuania is more development than an averge Cental and Eastern European state, but not quite there to be as developed as an average Western European state:
Final.groupby('Region')['HDI Score'].mean()
Region
Australia and New Zealand          0.933600
Central and Eastern Europe         0.800508
Eastern Asia                       0.827200
Latin America and Caribbean        0.729290
Middle East and Northern Africa    0.758482
North America                      0.924500
Southeastern Asia                  0.720900
Southern Asia                      0.616486
Sub-Saharan Africa                 0.529873
Western Europe                     0.919589
Name: HDI Score, dtype: float64
In 2019, Lithuania was among the most developed countries in CEE, left behind only by Slovenia, Czech Republic and Estonia.
Final_DS_CEE = WHR_HDI_2019[WHR_HDI_2019['Region'] == 'Central and Eastern Europe'].sort_values(by='HDI Score', ascending=False)
Final_DS_CEE
| Region | Happiness Rank | Happiness Score | Economy (GDP per Capita) | Social Support | Health (Life Expectancy) | Freedom to Make Life Choices | Government Corruption | Generosity | HDI Score | ||
|---|---|---|---|---|---|---|---|---|---|---|---|
| Year | Country | ||||||||||
| 2019 | Slovenia | Central and Eastern Europe | 44 | 6.118 | 1.258 | 1.523 | 0.953 | 0.564 | 0.057 | 0.144 | 0.917 |
| Czech Republic | Central and Eastern Europe | 20 | 6.852 | 1.269 | 1.487 | 0.920 | 0.457 | 0.036 | 0.046 | 0.900 | |
| Estonia | Central and Eastern Europe | 55 | 5.893 | 1.237 | 1.528 | 0.874 | 0.495 | 0.161 | 0.103 | 0.892 | |
| Lithuania | Central and Eastern Europe | 42 | 6.149 | 1.238 | 1.515 | 0.818 | 0.291 | 0.042 | 0.043 | 0.882 | |
| Poland | Central and Eastern Europe | 40 | 6.182 | 1.206 | 1.438 | 0.884 | 0.483 | 0.050 | 0.117 | 0.881 | |
| Latvia | Central and Eastern Europe | 53 | 5.940 | 1.187 | 1.465 | 0.812 | 0.264 | 0.064 | 0.075 | 0.866 | |
| Slovakia | Central and Eastern Europe | 38 | 6.198 | 1.246 | 1.504 | 0.881 | 0.334 | 0.014 | 0.121 | 0.860 | |
| Hungary | Central and Eastern Europe | 62 | 5.758 | 1.201 | 1.410 | 0.828 | 0.199 | 0.020 | 0.081 | 0.855 | |
| Croatia | Central and Eastern Europe | 75 | 5.432 | 1.155 | 1.266 | 0.914 | 0.296 | 0.022 | 0.119 | 0.850 | |
| Romania | Central and Eastern Europe | 48 | 6.070 | 1.162 | 1.232 | 0.825 | 0.462 | 0.005 | 0.083 | 0.828 | |
| Kazakhstan | Central and Eastern Europe | 60 | 5.809 | 1.173 | 1.508 | 0.729 | 0.410 | 0.096 | 0.146 | 0.825 | |
| Belarus | Central and Eastern Europe | 81 | 5.323 | 1.067 | 1.465 | 0.789 | 0.235 | 0.142 | 0.094 | 0.823 | |
| Bulgaria | Central and Eastern Europe | 97 | 5.011 | 1.092 | 1.513 | 0.815 | 0.311 | 0.004 | 0.081 | 0.816 | |
| Georgia | Central and Eastern Europe | 119 | 4.519 | 0.886 | 0.666 | 0.752 | 0.346 | 0.164 | 0.043 | 0.812 | |
| Serbia | Central and Eastern Europe | 70 | 5.603 | 1.004 | 1.383 | 0.854 | 0.282 | 0.039 | 0.137 | 0.806 | |
| Albania | Central and Eastern Europe | 107 | 4.719 | 0.947 | 0.848 | 0.874 | 0.383 | 0.027 | 0.178 | 0.794 | |
| Bosnia and Herzegovina | Central and Eastern Europe | 78 | 5.386 | 0.945 | 1.212 | 0.845 | 0.212 | 0.006 | 0.263 | 0.780 | |
| Ukraine | Central and Eastern Europe | 133 | 4.332 | 0.820 | 1.390 | 0.739 | 0.178 | 0.010 | 0.187 | 0.779 | |
| Armenia | Central and Eastern Europe | 116 | 4.559 | 0.850 | 1.055 | 0.815 | 0.283 | 0.064 | 0.095 | 0.776 | |
| Azerbaijan | Central and Eastern Europe | 90 | 5.208 | 1.043 | 1.147 | 0.769 | 0.351 | 0.182 | 0.035 | 0.756 | |
| Kosovo | Central and Eastern Europe | 46 | 6.100 | 0.882 | 1.232 | 0.758 | 0.489 | 0.006 | 0.262 | 0.750 | |
| Moldova | Central and Eastern Europe | 71 | 5.529 | 0.685 | 1.328 | 0.739 | 0.245 | 0.000 | 0.181 | 0.749 | |
| Uzbekistan | Central and Eastern Europe | 41 | 6.174 | 0.745 | 1.529 | 0.756 | 0.631 | 0.240 | 0.322 | 0.721 | |
| Turkmenistan | Central and Eastern Europe | 87 | 5.247 | 1.052 | 1.538 | 0.657 | 0.394 | 0.028 | 0.244 | 0.716 | |
| Kyrgyzstan | Central and Eastern Europe | 86 | 5.261 | 0.551 | 1.438 | 0.723 | 0.508 | 0.023 | 0.300 | 0.698 | |
| Tajikistan | Central and Eastern Europe | 74 | 5.467 | 0.493 | 1.098 | 0.718 | 0.389 | 0.144 | 0.230 | 0.668 |
In the Baltic region, Estonia was the most development state between 2015 and 2019 and Lithuania came in second, leaving behind Poland and Latvia:
Final_DS_EE = Final[Final['Country'] == 'Estonia']
Final_DS_EE['HDI Score'].mean()
0.8852
Final_DS_LT = Final[Final['Country'] == 'Lithuania']
Final_DS_LT['HDI Score'].mean()
0.8725999999999999
Final_DS_PL = Final[Final['Country'] == 'Poland']
Final_DS_PL['HDI Score'].mean()
0.8724000000000001
Final_DS_LV = Final[Final['Country'] == 'Latvia']
Final_DS_LV['HDI Score'].mean()
0.8583999999999999
On the Baltic Region level, this means that Estonia is the most developed and the most unhappy state, even though Estonia's level of happiness also showed positive relationship to its human development level:
Final_HS_DS_EE = Final[Final['Country'] == 'Estonia']
Final_HS_DS_EE = Final_HS_DS_EE[['Happiness Score', 'HDI Score']]
Final_HS_DS_EE
| Happiness Score | HDI Score | |
|---|---|---|
| Year | ||
| 2015 | 5.429 | 0.877 |
| 2016 | 5.517 | 0.882 |
| 2017 | 5.611 | 0.885 |
| 2018 | 5.739 | 0.890 |
| 2019 | 5.893 | 0.892 |
Final_HS_DS_EE.T
| Year | 2015 | 2016 | 2017 | 2018 | 2019 |
|---|---|---|---|---|---|
| Happiness Score | 5.429 | 5.517 | 5.611 | 5.739 | 5.893 |
| HDI Score | 0.877 | 0.882 | 0.885 | 0.890 | 0.892 |
Final_HS_DS_EE.plot(x='HDI Score', y='Happiness Score', title='Estonia\'s Development and Happiness Between 2015 and 2019')
<AxesSubplot:title={'center':"Estonia's Development and Happiness Between 2015 and 2019"}, xlabel='HDI Score'>

On an aggreggate level, cross-sectional time-series data tells us that there is a strong positive relationship between the country's development level of its level of happiness:
Final.plot(x='HDI Score', y='Happiness Score', title='The Relationship Between Development and Happiness', kind='scatter')
<AxesSubplot:title={'center':'The Relationship Between Development and Happiness'}, xlabel='HDI Score', ylabel='Happiness Score'>

However, one cannot come to a conclusion that the level of country's happiness can be explained and predicted by its level of human development:
from sklearn.linear_model import LinearRegression
X = Final[['HDI Score']]
X
| HDI Score | |
|---|---|
| Year | |
| 2015 | 0.948 |
| 2015 | 0.934 |
| 2015 | 0.933 |
| 2015 | 0.947 |
| 2015 | 0.920 |
| ... | ... |
| 2019 | 0.470 |
| 2019 | 0.543 |
| 2019 | 0.528 |
| 2019 | 0.511 |
| 2019 | 0.433 |
691 rows × 1 columns
y = Final['Happiness Score']
y
Year
2015    7.587
2015    7.561
2015    7.527
2015    7.522
2015    7.427
        ...
2019    3.380
2019    3.334
2019    3.231
2019    3.203
2019    2.853
Name: Happiness Score, Length: 691, dtype: float64
model = LinearRegression()
model.fit(X, y)
model.predict([[1]])
array([7.02415971])
r_squared = model.score(X, y)
r_squared
0.656350123713956
This conclusion stems from a fact that in a direct linear regression the HDI score explains roughly 65% of cases of country's happiness level. Thus, the hypothesis that Human Development Index explains the country's Happiness Level is rejected. An alternative model must be tested:
X = Final[['Economy (GDP per Capita)', 'Social Support', 'Health (Life Expectancy)', 'Freedom to Make Life Choices', 'Government Corruption', 'Generosity', 'HDI Score']]
X
| Economy (GDP per Capita) | Social Support | Health (Life Expectancy) | Freedom to Make Life Choices | Government Corruption | Generosity | HDI Score | |
|---|---|---|---|---|---|---|---|
| Year | |||||||
| 2015 | 1.39651 | 1.34951 | 0.94143 | 0.66557 | 0.41978 | 0.29678 | 0.948 |
| 2015 | 1.30232 | 1.40223 | 0.94784 | 0.62877 | 0.14145 | 0.43630 | 0.934 |
| 2015 | 1.32548 | 1.36058 | 0.87464 | 0.64938 | 0.48357 | 0.34139 | 0.933 |
| 2015 | 1.45900 | 1.33095 | 0.88521 | 0.66973 | 0.36503 | 0.34699 | 0.947 |
| 2015 | 1.32629 | 1.32261 | 0.90563 | 0.63297 | 0.32957 | 0.45811 | 0.920 |
| ... | ... | ... | ... | ... | ... | ... | ... |
| 2019 | 0.28700 | 1.16300 | 0.46300 | 0.14300 | 0.07700 | 0.10800 | 0.470 |
| 2019 | 0.35900 | 0.71100 | 0.61400 | 0.55500 | 0.41100 | 0.21700 | 0.543 |
| 2019 | 0.47600 | 0.88500 | 0.49900 | 0.41700 | 0.14700 | 0.27600 | 0.528 |
| 2019 | 0.35000 | 0.51700 | 0.36100 | 0.00000 | 0.02500 | 0.15800 | 0.511 |
| 2019 | 0.30600 | 0.57500 | 0.29500 | 0.01000 | 0.09100 | 0.20200 | 0.433 |
691 rows × 7 columns
y = Final['Happiness Score']
y
Year
2015    7.587
2015    7.561
2015    7.527
2015    7.522
2015    7.427
        ...
2019    3.380
2019    3.334
2019    3.231
2019    3.203
2019    2.853
Name: Happiness Score, Length: 691, dtype: float64
model = LinearRegression()
model.fit(X, y)
r_squared = model.score(X, y)
r_squared
0.7713549273193673
from sklearn.model_selection import train_test_split
train_test_split(X, y, test_size=0.15)
[      Economy (GDP per Capita)  Social Support  Health (Life Expectancy)  \
 Year
 2019                  1.124000        1.465000                  0.891000
 2015                  0.864020        0.999030                  0.790750
 2019                  0.570000        1.167000                  0.489000
 2016                  1.186490        0.608090                  0.705240
 2019                  1.433000        1.457000                  0.874000
 ...                        ...             ...                       ...
 2015                  1.228570        1.223930                  0.913870
 2016                  0.794220        0.837790                  0.469700
 2017                  1.122094        1.221555                  0.341756
 2015                  1.563910        1.219630                  0.918940
 2017                  1.494387        1.478162                  0.830875

       Freedom to Make Life Choices  Government Corruption  Generosity  \
 Year
 2019                      0.523000               0.150000    0.127000
 2015                      0.485740               0.180900    0.115410
 2019                      0.066000               0.088000    0.106000
 2016                      0.239070               0.040020    0.184340
 2019                      0.454000               0.128000    0.280000
 ...                            ...                    ...         ...
 2015                      0.413190               0.077850    0.331720
 2016                      0.509610               0.077460    0.216980
 2017                      0.505196               0.098583    0.099348
 2015                      0.615830               0.377980    0.280340
 2017                      0.612924               0.384399    0.385399

       HDI Score
 Year
 2019      0.817
 2015      0.764
 2019      0.546
 2016      0.841
 2019      0.926
 ...         ...
 2015      0.910
 2016      0.702
 2017      0.725
 2015      0.906
 2017      0.941

 [587 rows x 7 columns],
       Economy (GDP per Capita)  Social Support  Health (Life Expectancy)  \
 Year
 2015                  1.325480        1.360580                  0.874640
 2016                  1.337660        0.995370                  0.849170
 2016                  0.328460        0.615860                  0.318650
 2015                  0.632160        0.912260                  0.746760
 2019                  0.987000        1.224000                  0.815000
 ...                        ...             ...                       ...
 2017                  1.189396        1.209561                  0.638007
 2015                  1.159910        1.139350                  0.875190
 2015                  1.061660        1.208900                  0.811600
 2016                  0.422140        0.631780                  0.038240
 2019                  1.324000        1.472000                  1.045000

       Freedom to Make Life Choices  Government Corruption  Generosity  \
 Year
 2015                      0.649380               0.483570    0.341390
 2016                      0.364320               0.087280    0.322880
 2016                      0.543200               0.505210    0.235520
 2015                      0.594440               0.104410    0.168600
 2019                      0.216000               0.027000    0.166000
 ...                            ...                    ...         ...
 2017                      0.491247               0.042182    0.360934
 2015                      0.514690               0.010780    0.137190
 2015                      0.603620               0.245580    0.232400
 2016                      0.128070               0.049520    0.186670
 2019                      0.436000               0.183000    0.111000

       HDI Score
 Year
 2015      0.933
 2016      0.913
 2016      0.527
 2015      0.689
 2019      0.744
 ...         ...
 2017      0.797
 2015      0.855
 2015      0.806
 2016      0.394
 2019      0.901

 [104 rows x 7 columns],
 Year
 2019    6.293
 2015    5.975
 2019    4.490
 2016    5.488
 2019    6.892
         ...
 2015    7.278
 2016    5.822
 2017    3.766
 2015    6.946
 2017    7.284
 Name: Happiness Score, Length: 587, dtype: float64,
 Year
 2015    7.527
 2016    7.267
 2016    3.515
 2015    5.360
 2019    5.197
         ...
 2017    5.629
 2015    5.102
 2015    6.485
 2016    3.763
 2019    6.592
 Name: Happiness Score, Length: 104, dtype: float64]
X_train, X_test, y_train, y_test = train_test_split(X, y, test_size=0.15)
model = LinearRegression()
model.fit(X_train, y_train)
y_predicted = model.predict(X_test)
model.score(X_test, y_test)
0.7905049148130956
We can come to the conclusion that any country's level of happiness cannot be explained by its pure HDI Score, but rather a broader measure of its human and social development, which includes factors, such as Social Support, Freedom to Make Life Choices, Government Corruption, Generosity, along the HDI Score.
As an example, one can you use the model above to provide predicted values of the inputs below and come up with a predicted level of happiness for any country in the world, including Lithuania:
◉ Economy (GDP per Capita
◉ Social Support
◉ Health (Life Expectancy)
◉ Freedom to Make Life Choices
◉ Government Corruption
◉ Generosity
◉ HDI Score
If we can predict all these variables, we can also predict the future level of happiness of Lithuania:
Final_LT = Final[Final['Country'] == 'Lithuania']
Final_LT
| Country | Region | Happiness Rank | Happiness Score | Economy (GDP per Capita) | Social Support | Health (Life Expectancy) | Freedom to Make Life Choices | Government Corruption | Generosity | HDI Score | |
|---|---|---|---|---|---|---|---|---|---|---|---|
| Year | |||||||||||
| 2015 | Lithuania | Central and Eastern Europe | 56 | 5.833 | 1.147230 | 1.257450 | 0.73128 | 0.213420 | 0.010310 | 0.026410 | 0.863 |
| 2016 | Lithuania | Central and Eastern Europe | 60 | 5.813 | 1.269200 | 1.064110 | 0.64674 | 0.189290 | 0.018200 | 0.020250 | 0.868 |
| 2017 | Lithuania | Central and Eastern Europe | 52 | 5.902 | 1.314582 | 1.473516 | 0.62895 | 0.234232 | 0.011866 | 0.010165 | 0.873 |
| 2018 | Lithuania | Central and Eastern Europe | 50 | 5.952 | 1.197000 | 1.527000 | 0.71600 | 0.350000 | 0.006000 | 0.026000 | 0.877 |
| 2019 | Lithuania | Central and Eastern Europe | 42 | 6.149 | 1.238000 | 1.515000 | 0.81800 | 0.291000 | 0.042000 | 0.043000 | 0.882 |
model.predict([[1.25, 1.52, 0.6, 0.3, 0.2, 0.35, 0.884]])
array([6.094927])
In this piece of research, one may come up with the following findings:
◉ Historically, countries have shown a positive relationship between their level of human development, determined by Human Development Index (HDI), and its level of happiness, assessed in World Health Report.
◉ However, the core hypothesis that the level of happiness in any country can be simply explained by its human development level is rejected.
◉ One cannot predict any country's level of happiness by pure human development level. The level of any state's happiness rather depends on broader development sense, which includes by human and social development and determining factors, such as: Social Support, Freedom to Make Life Choices, Government Corruption, Generosity, along the HDI Score.
◉ In the future, in addressing the happiness level of a society in Lithuania, the Government of Lithuania should not only facus on Economy (GDP), Health (Life Expectancy) and Education, summed up by HDI, but rather focus also on social factors, such as Social Support, Freedom to Make Life Choices, Government Corruption and Generosity.
◉ By predicting the future values of these variables, the Government of Lithuania will be able to predict the future level of happiness of Lithuania with a decent level of confidence.